Color Scale
What It Does
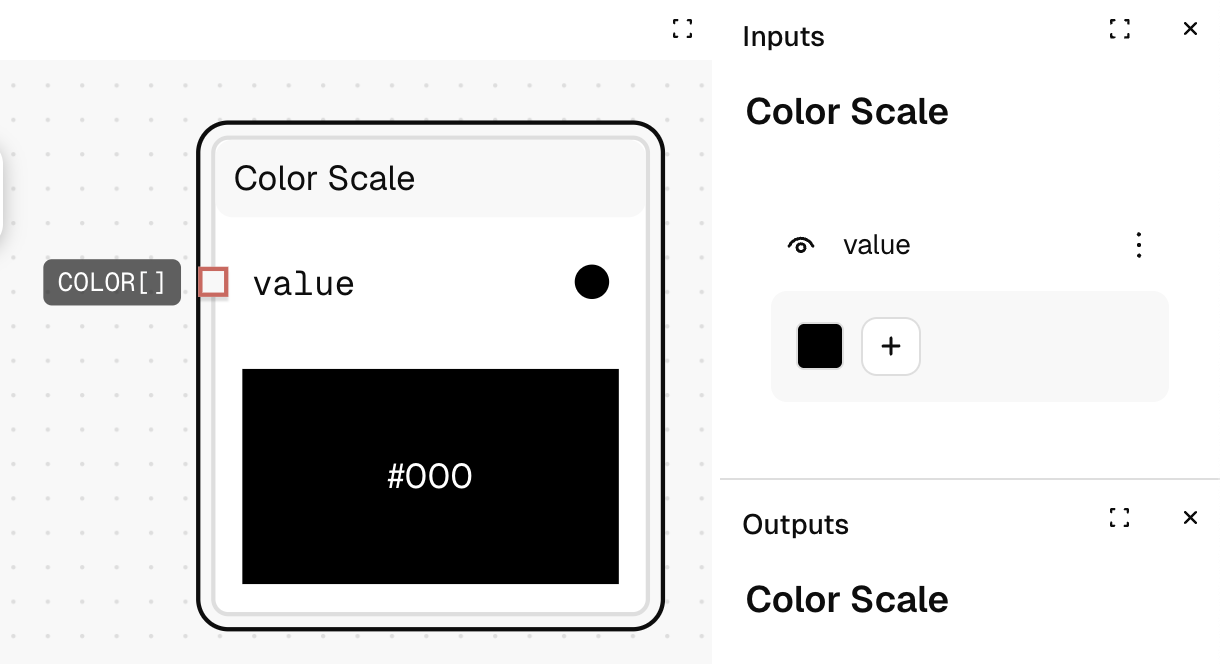
The Color Scale node visualizes a sequence of colors as a gradient or palette. It provides a preview of color scales for design systems or data visualizations.
Inputs
| Name | Description | Type | Required |
|---|---|---|---|
| Value | The array of colors to display as a scale | List | Yes |
Outputs
| Name | Description | Type |
|---|---|---|
| No outputs | This node is for preview purposes only | - |
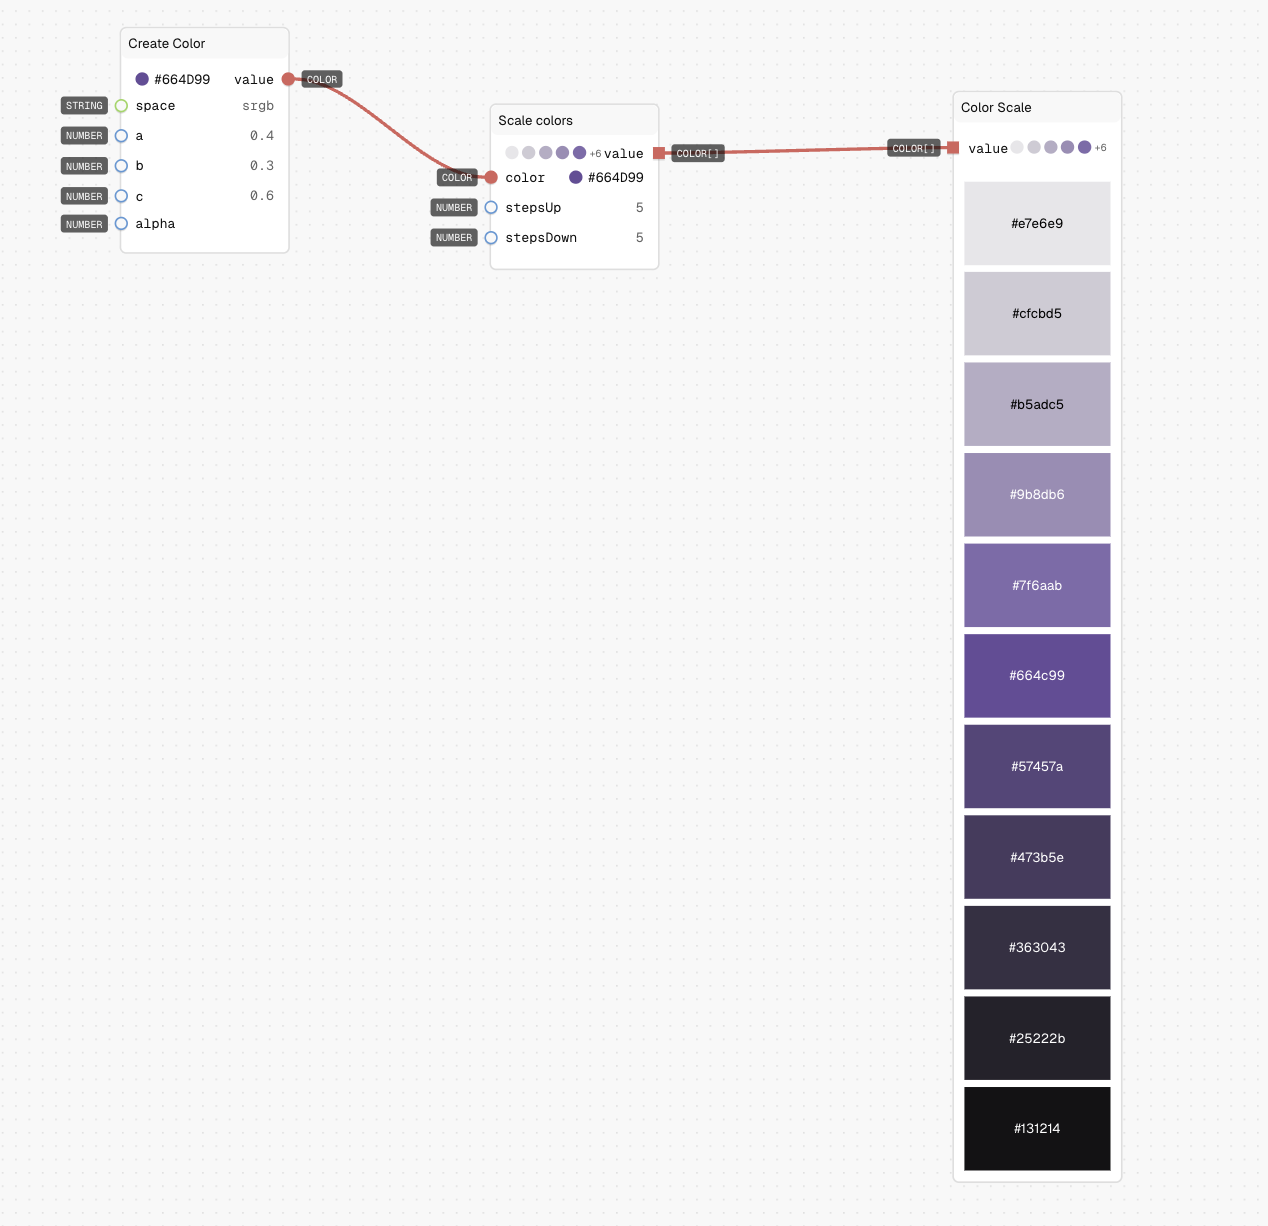
How to Use It
- Drag the Color Scale node into your graph.
- Connect an array of colors to the "Value" input.
- The node will display the colors as a continuous scale or discrete swatches.
- Use the preview to evaluate the visual progression of your color scale.
Tips
- Include at least 3-5 colors for a meaningful scale preview.
- Use this to check both color ramps and discrete palettes for consistency.
See Also
- Color Swatch: For previewing a single color.
- Color Compare: For comparing two specific colors.
Use Cases
- Gradient Validation: Visualize color gradients to ensure smooth transitions.
- Palette Design: Preview color palettes for cohesiveness and visual harmony.
- Data Visualization: Check color scales for data maps, charts, and graphs.