Editor
Overview
The Graph Engine UI provides an intuitive interface for creating, managing, and visualizing nodes and their connections. This guide walks you through the core components of the interface to help you navigate and utilize its features efficiently.
Read more about creating Graph Based sets.
Main Interface Sections
The Graph Engine UI consists of several panels and tools that help you manage nodes, edges, and settings.
Nodes Panel
- Displays all the available nodes categorized into sections and segments.
- Search and drag nodes onto the canvas.
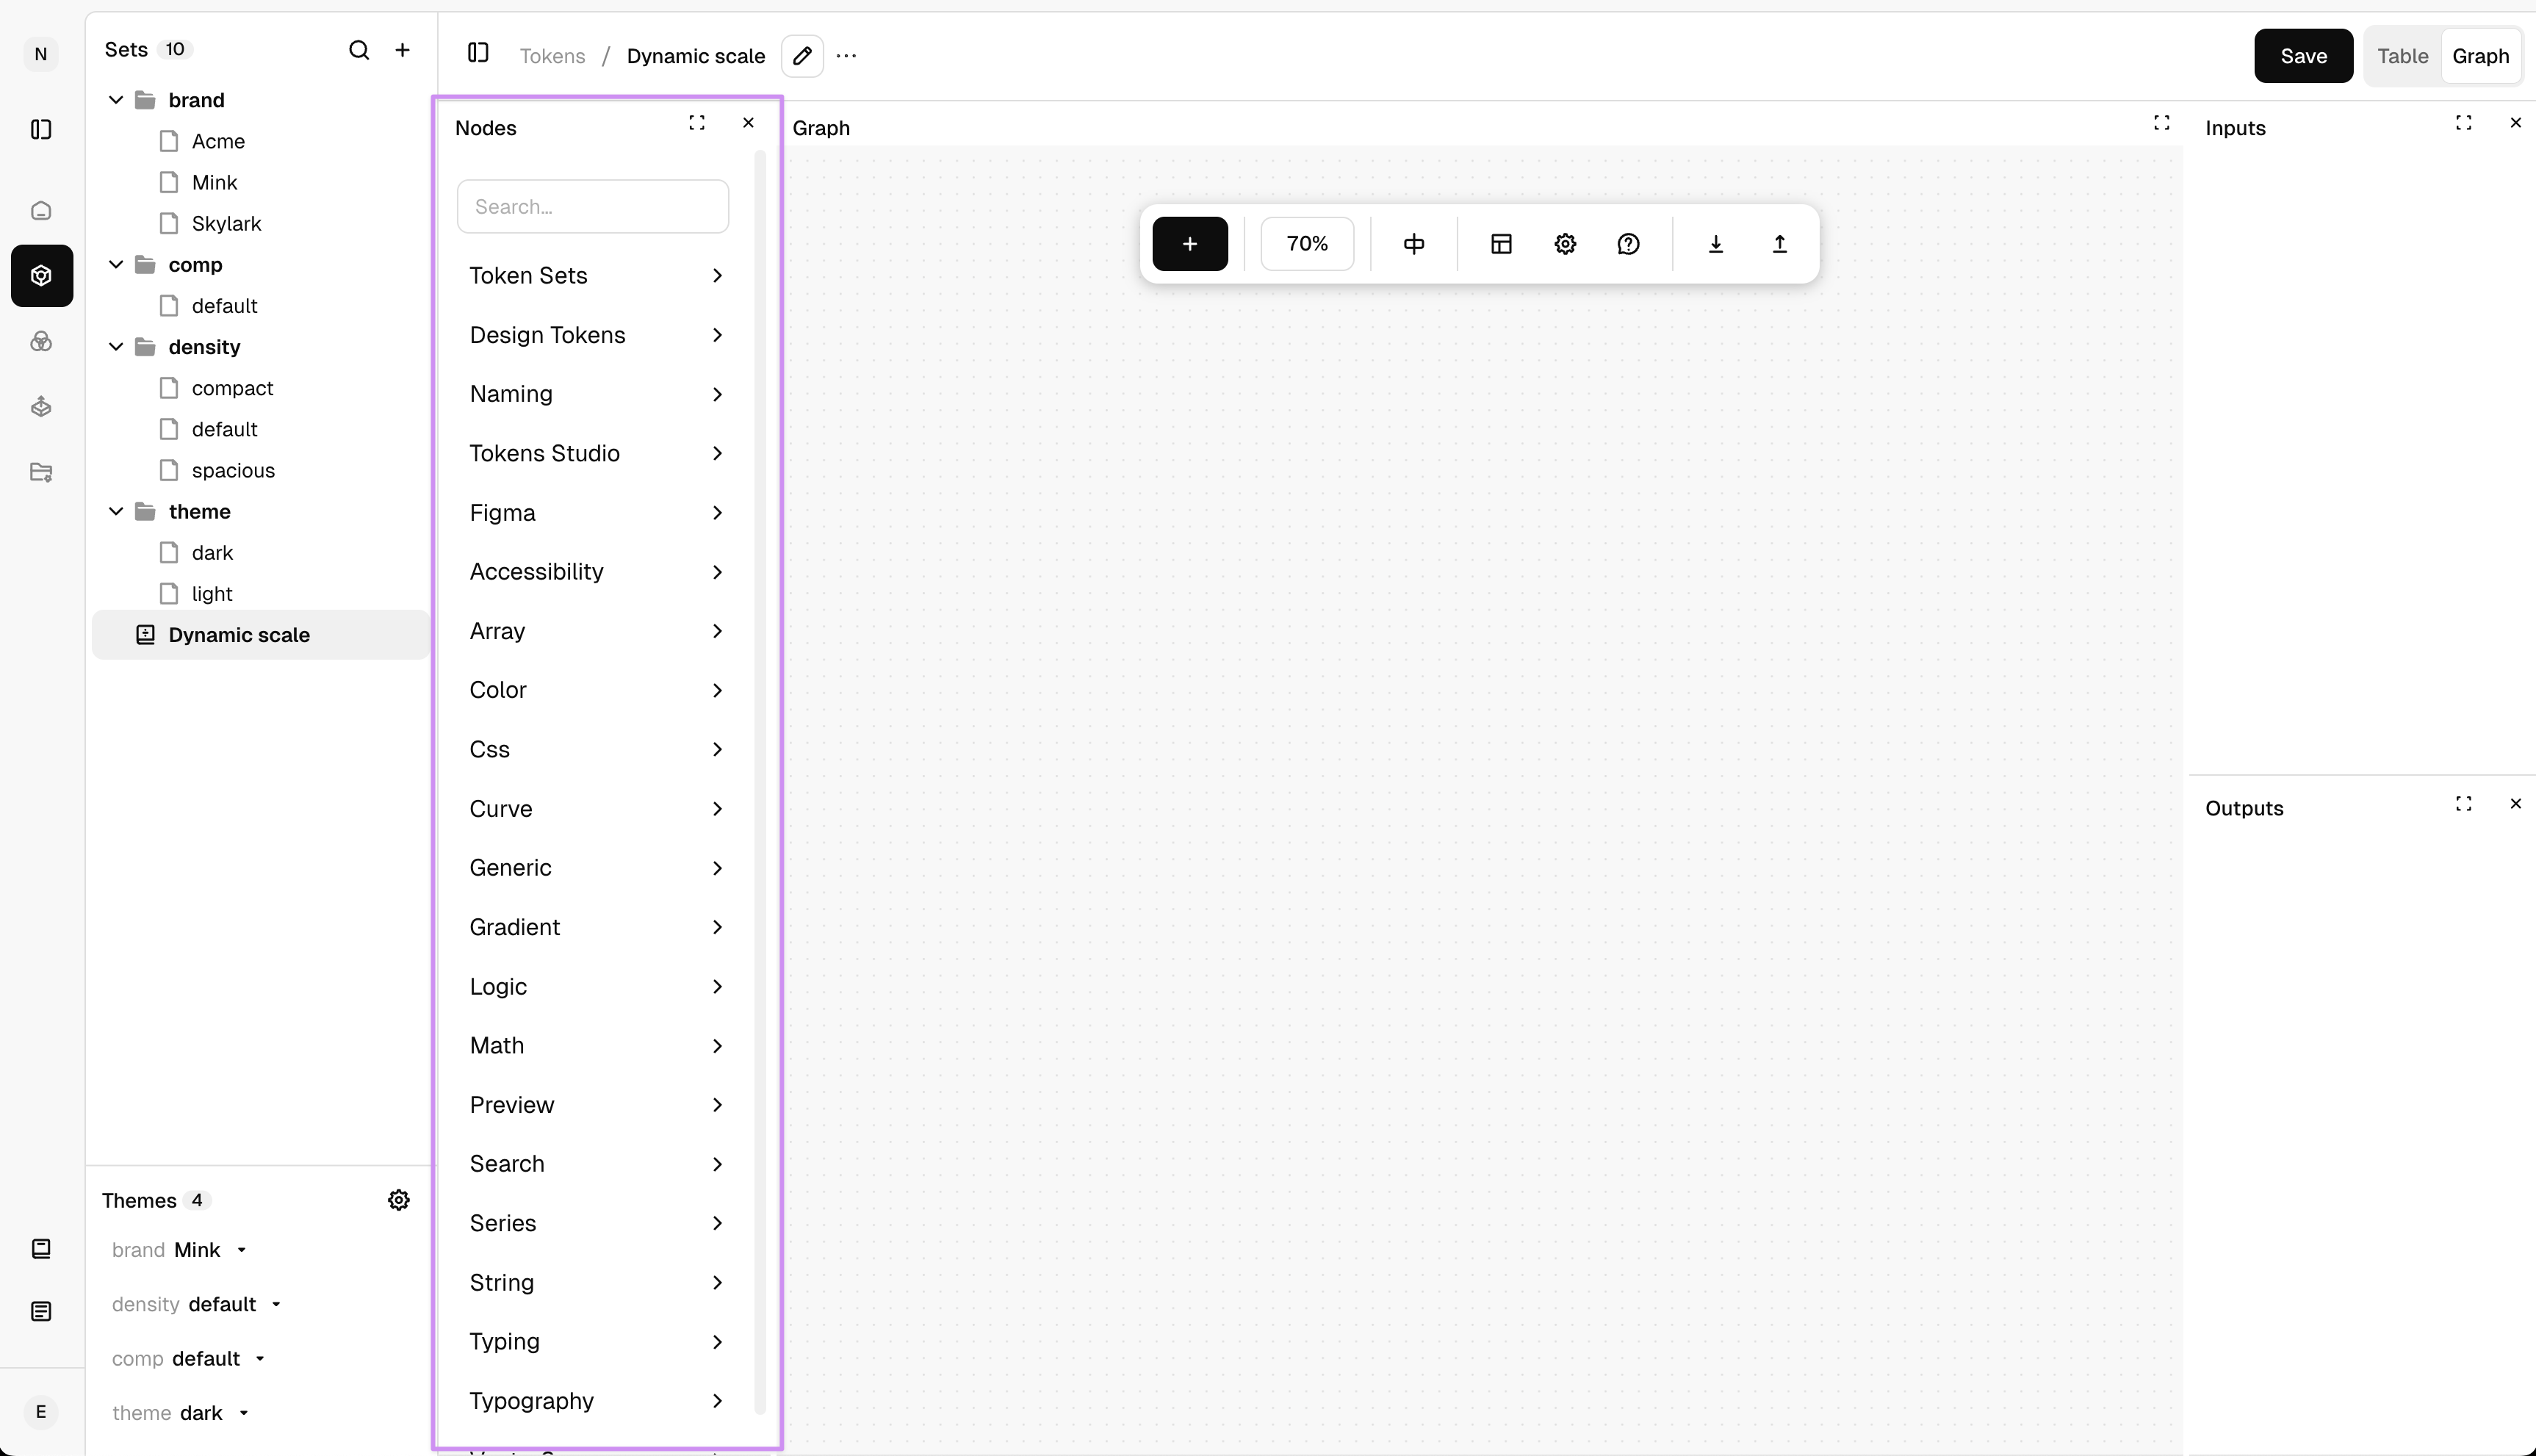
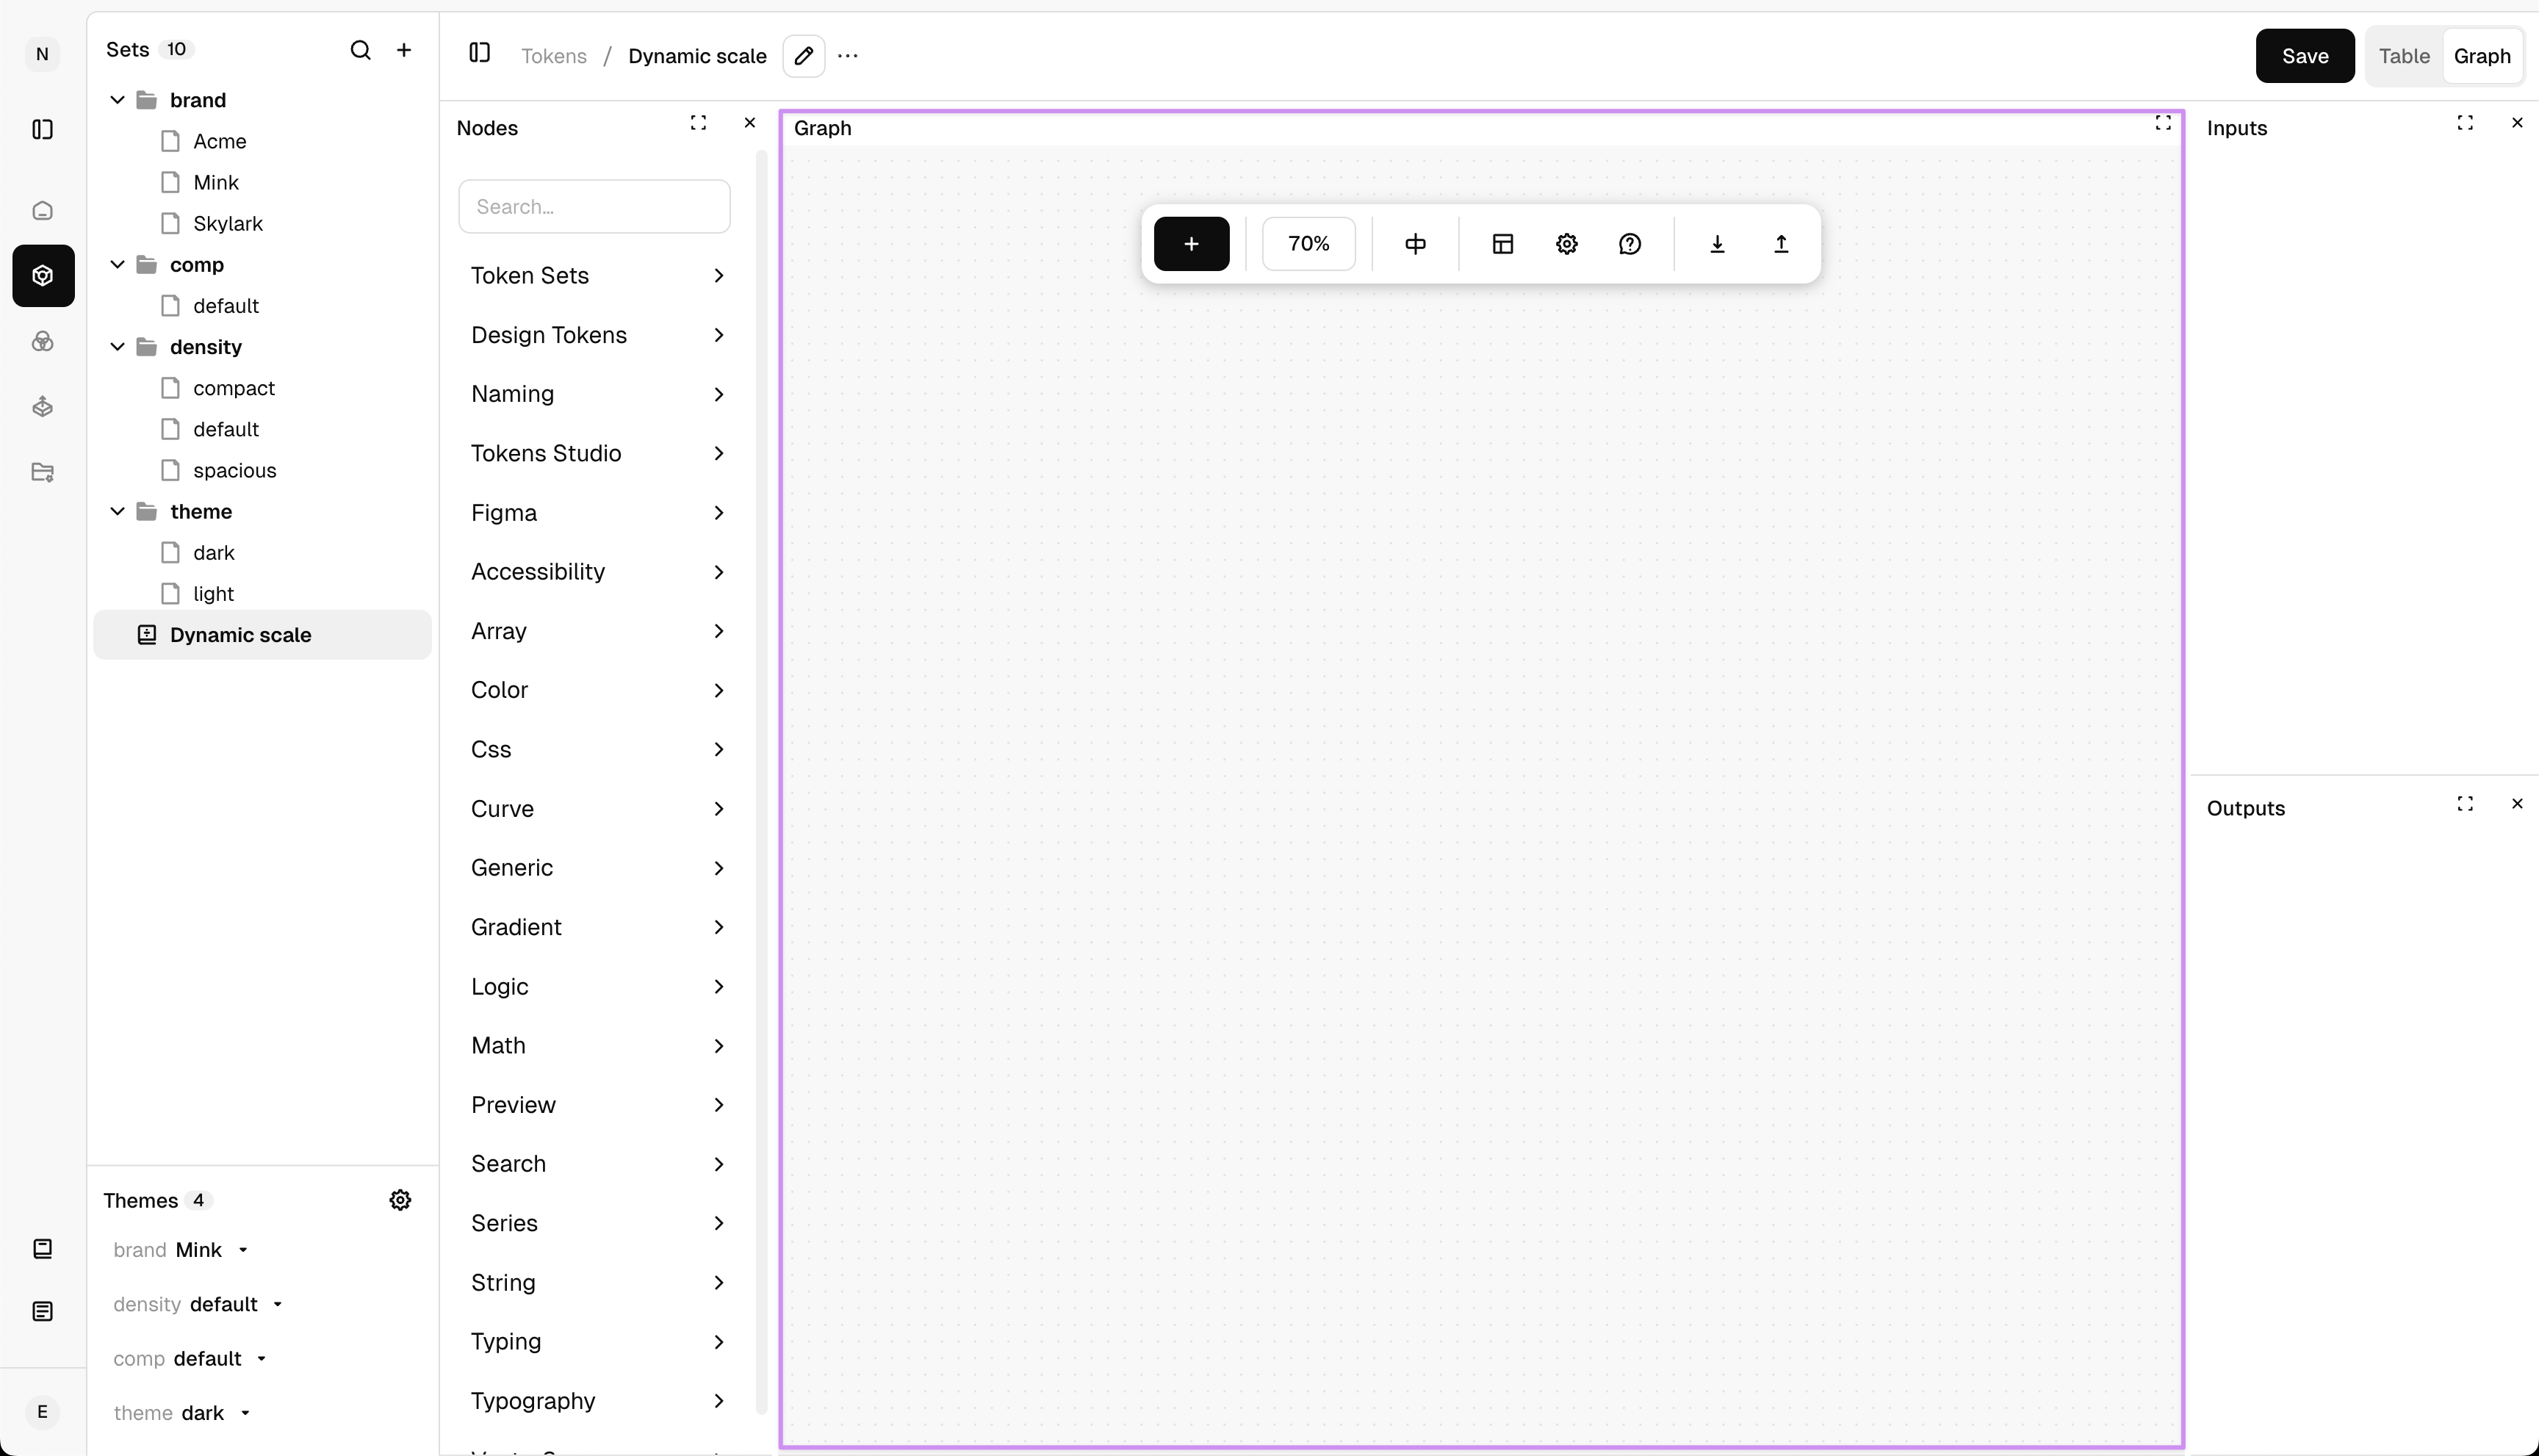
Center Panel (Graph Canvas)
This is the main workspace where you arrange and connect nodes.
Navigation controls:
- Zoom In/Out – Similar to Figma.
- Pan & Drag – Move around the canvas freely.
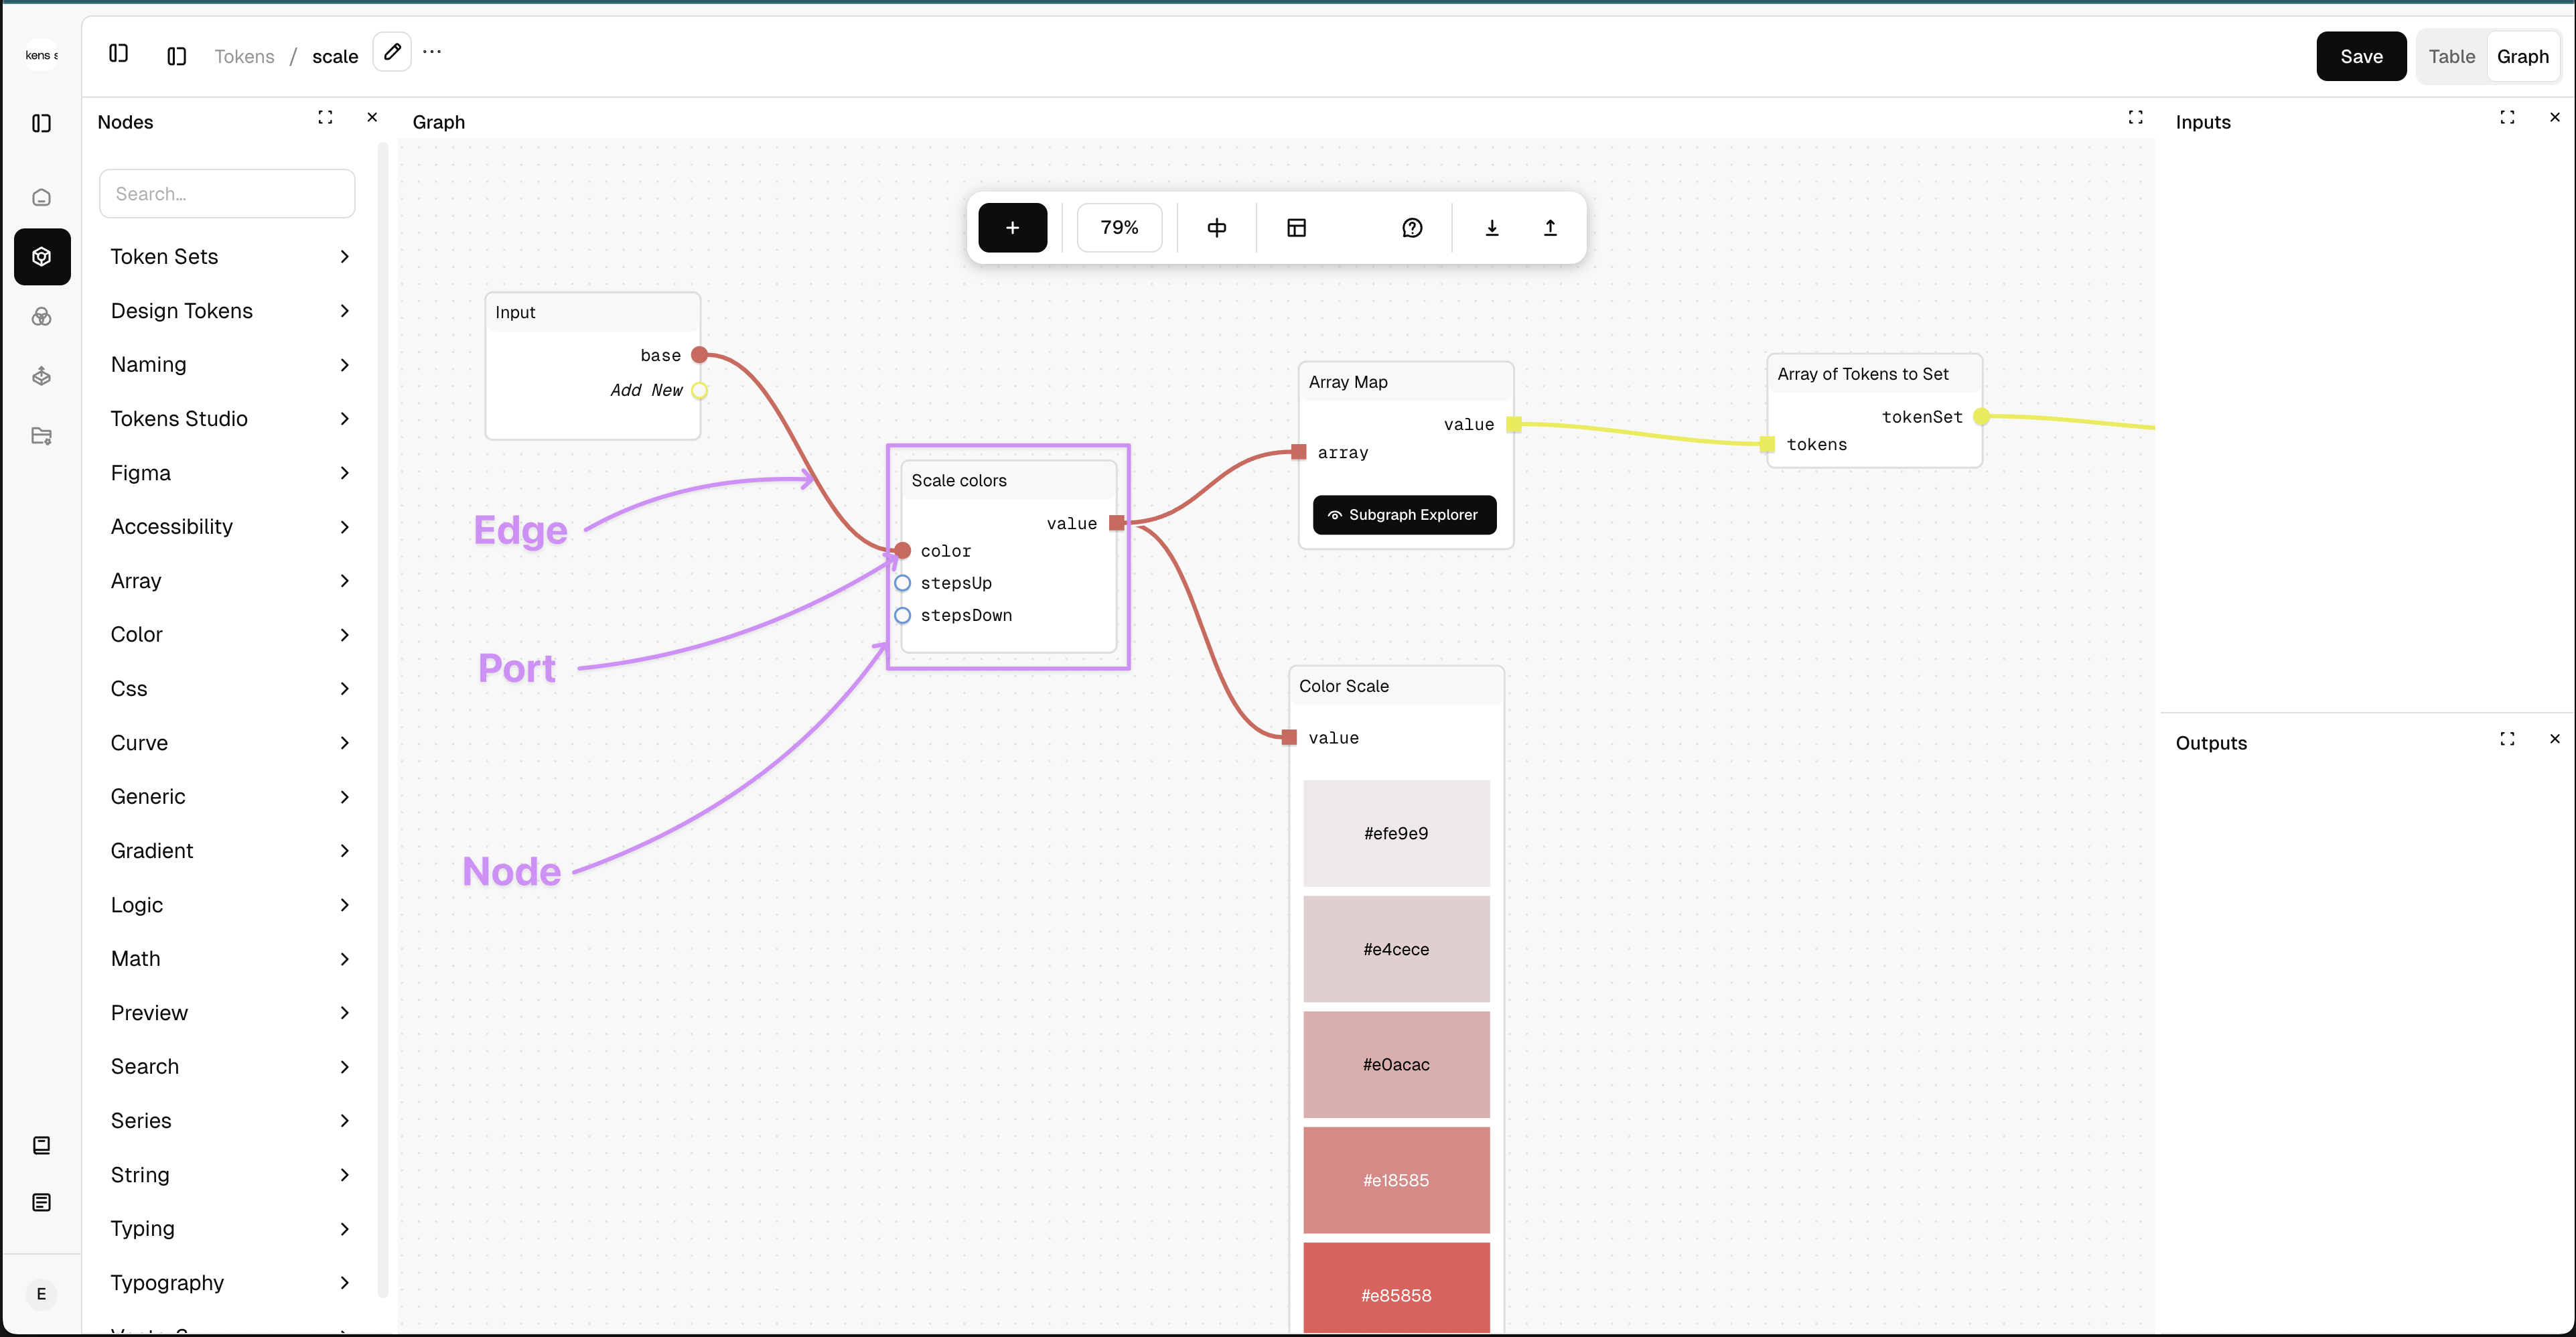
Graph Elements
- Nodes: Represent individual operations or data points.
- Edges: Connections between nodes that define relationships.
- Port: Ports are the connection points on a node that allow data to flow in and out. They define how nodes interact with each other by transmitting values, logic, or actions. Each node has one or more ports, categorized as inputs and outputs.
Top Action Bar
Provides quick actions for managing the graph.
- Add Node– Browse and insert nodes.
- Zoom Level Control – Adjust zoom percentage of the canvas.
- Node Alignment – Align and distribute nodes systematically.
- Layout Customization – Show/hide active panels.
- Graph Settings:
- Show Inline Types – Helps understand node data types.
- Show Inline Values – Displays real-time values at node ports.
- Use delayed interaction - Forces a user to click save to update port.
- Click to connect - Allows you to quick connect nodes by clicking on the 2 ports.
- Show execution time - Shows how long it takes for a node to process.
- Show Minimap - Shows the minimap in the graph editing area.
- Enable Context Menus - Provides right click context menus.
- Edge Type - Choose from Bezier, Smooth Step, Straight, Simple Bezier to customise how the connected edges appear.
- Layout Type - Choose from Dagre, Elk - Force, Elk - Rect, Elk - Layered, Elk - Stressed to align your nodes when using the Node Alignment option.
- Help & Support:
- Submit feedback via Featurebase.
- Access documentation.
- Access Tokens Studio Youtube channel.
- Access support and community on Slack.
- Download - Download your graph as a .json file.
- Upload - Upload any graph file.
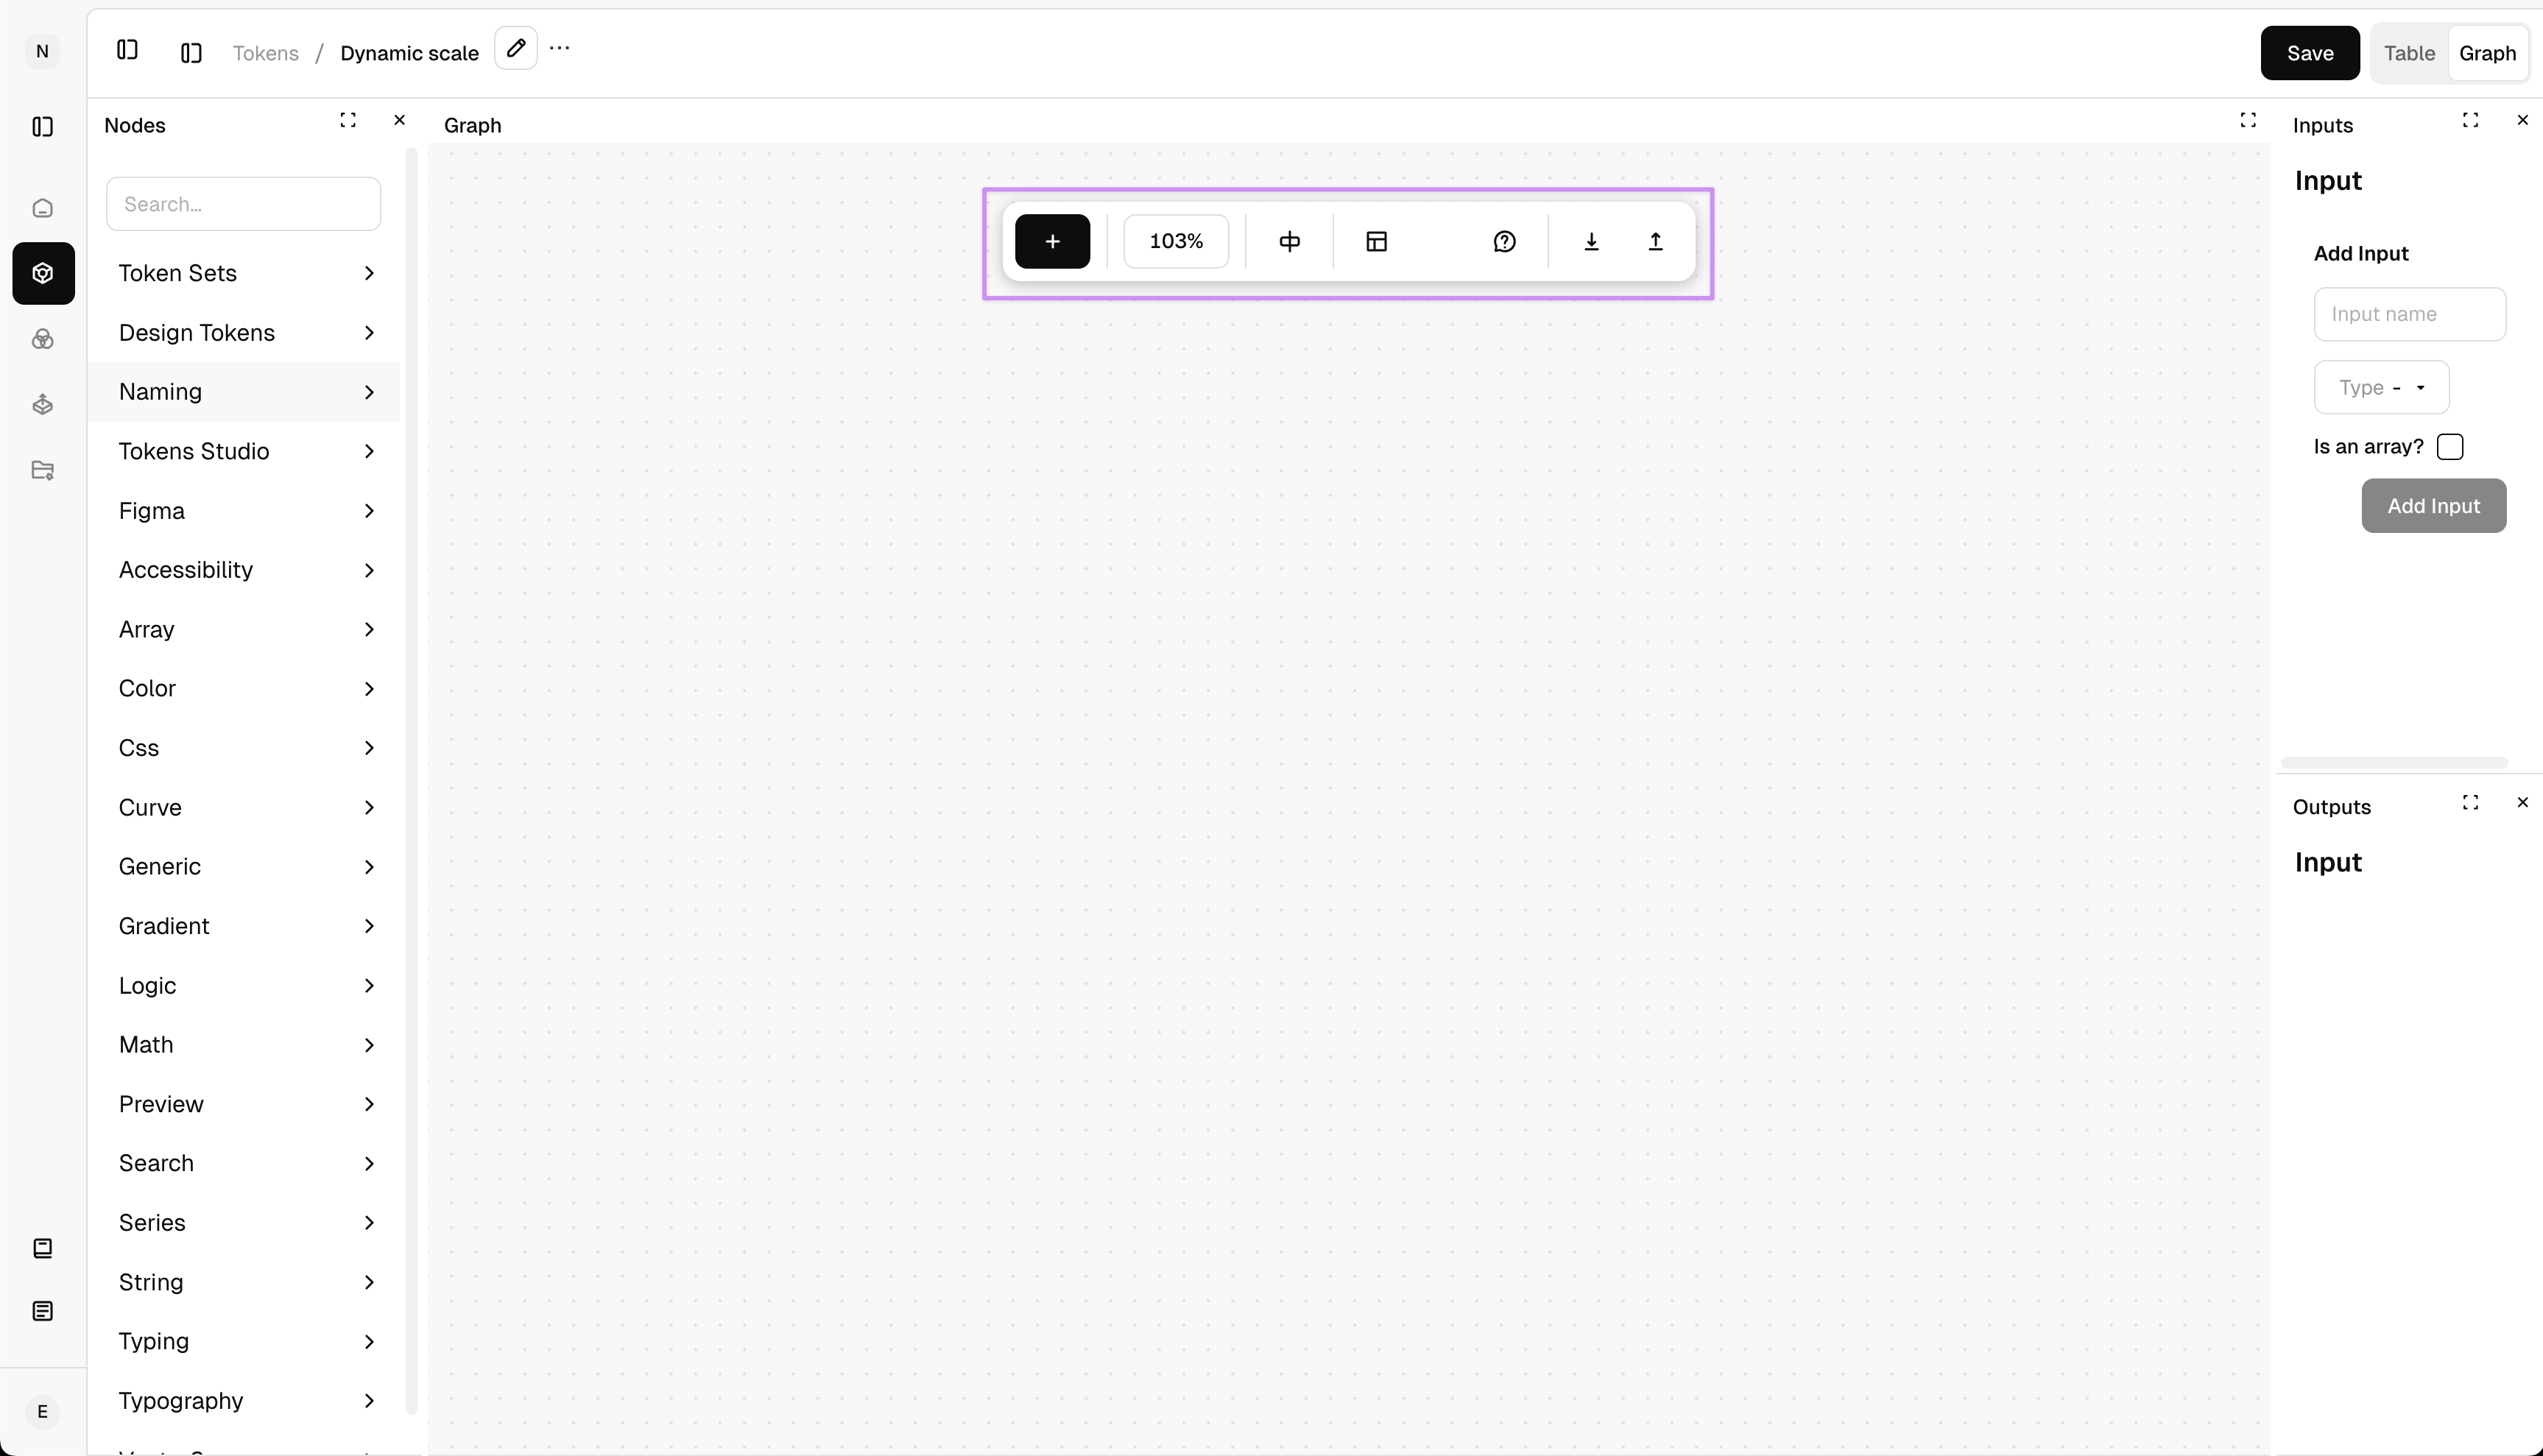
Right Panel
Used to manage inputs and outputs.
Inputs Section
- Displays all inputs for the selected node (left side of the node).
- Allows to modify values if not connected to another node.
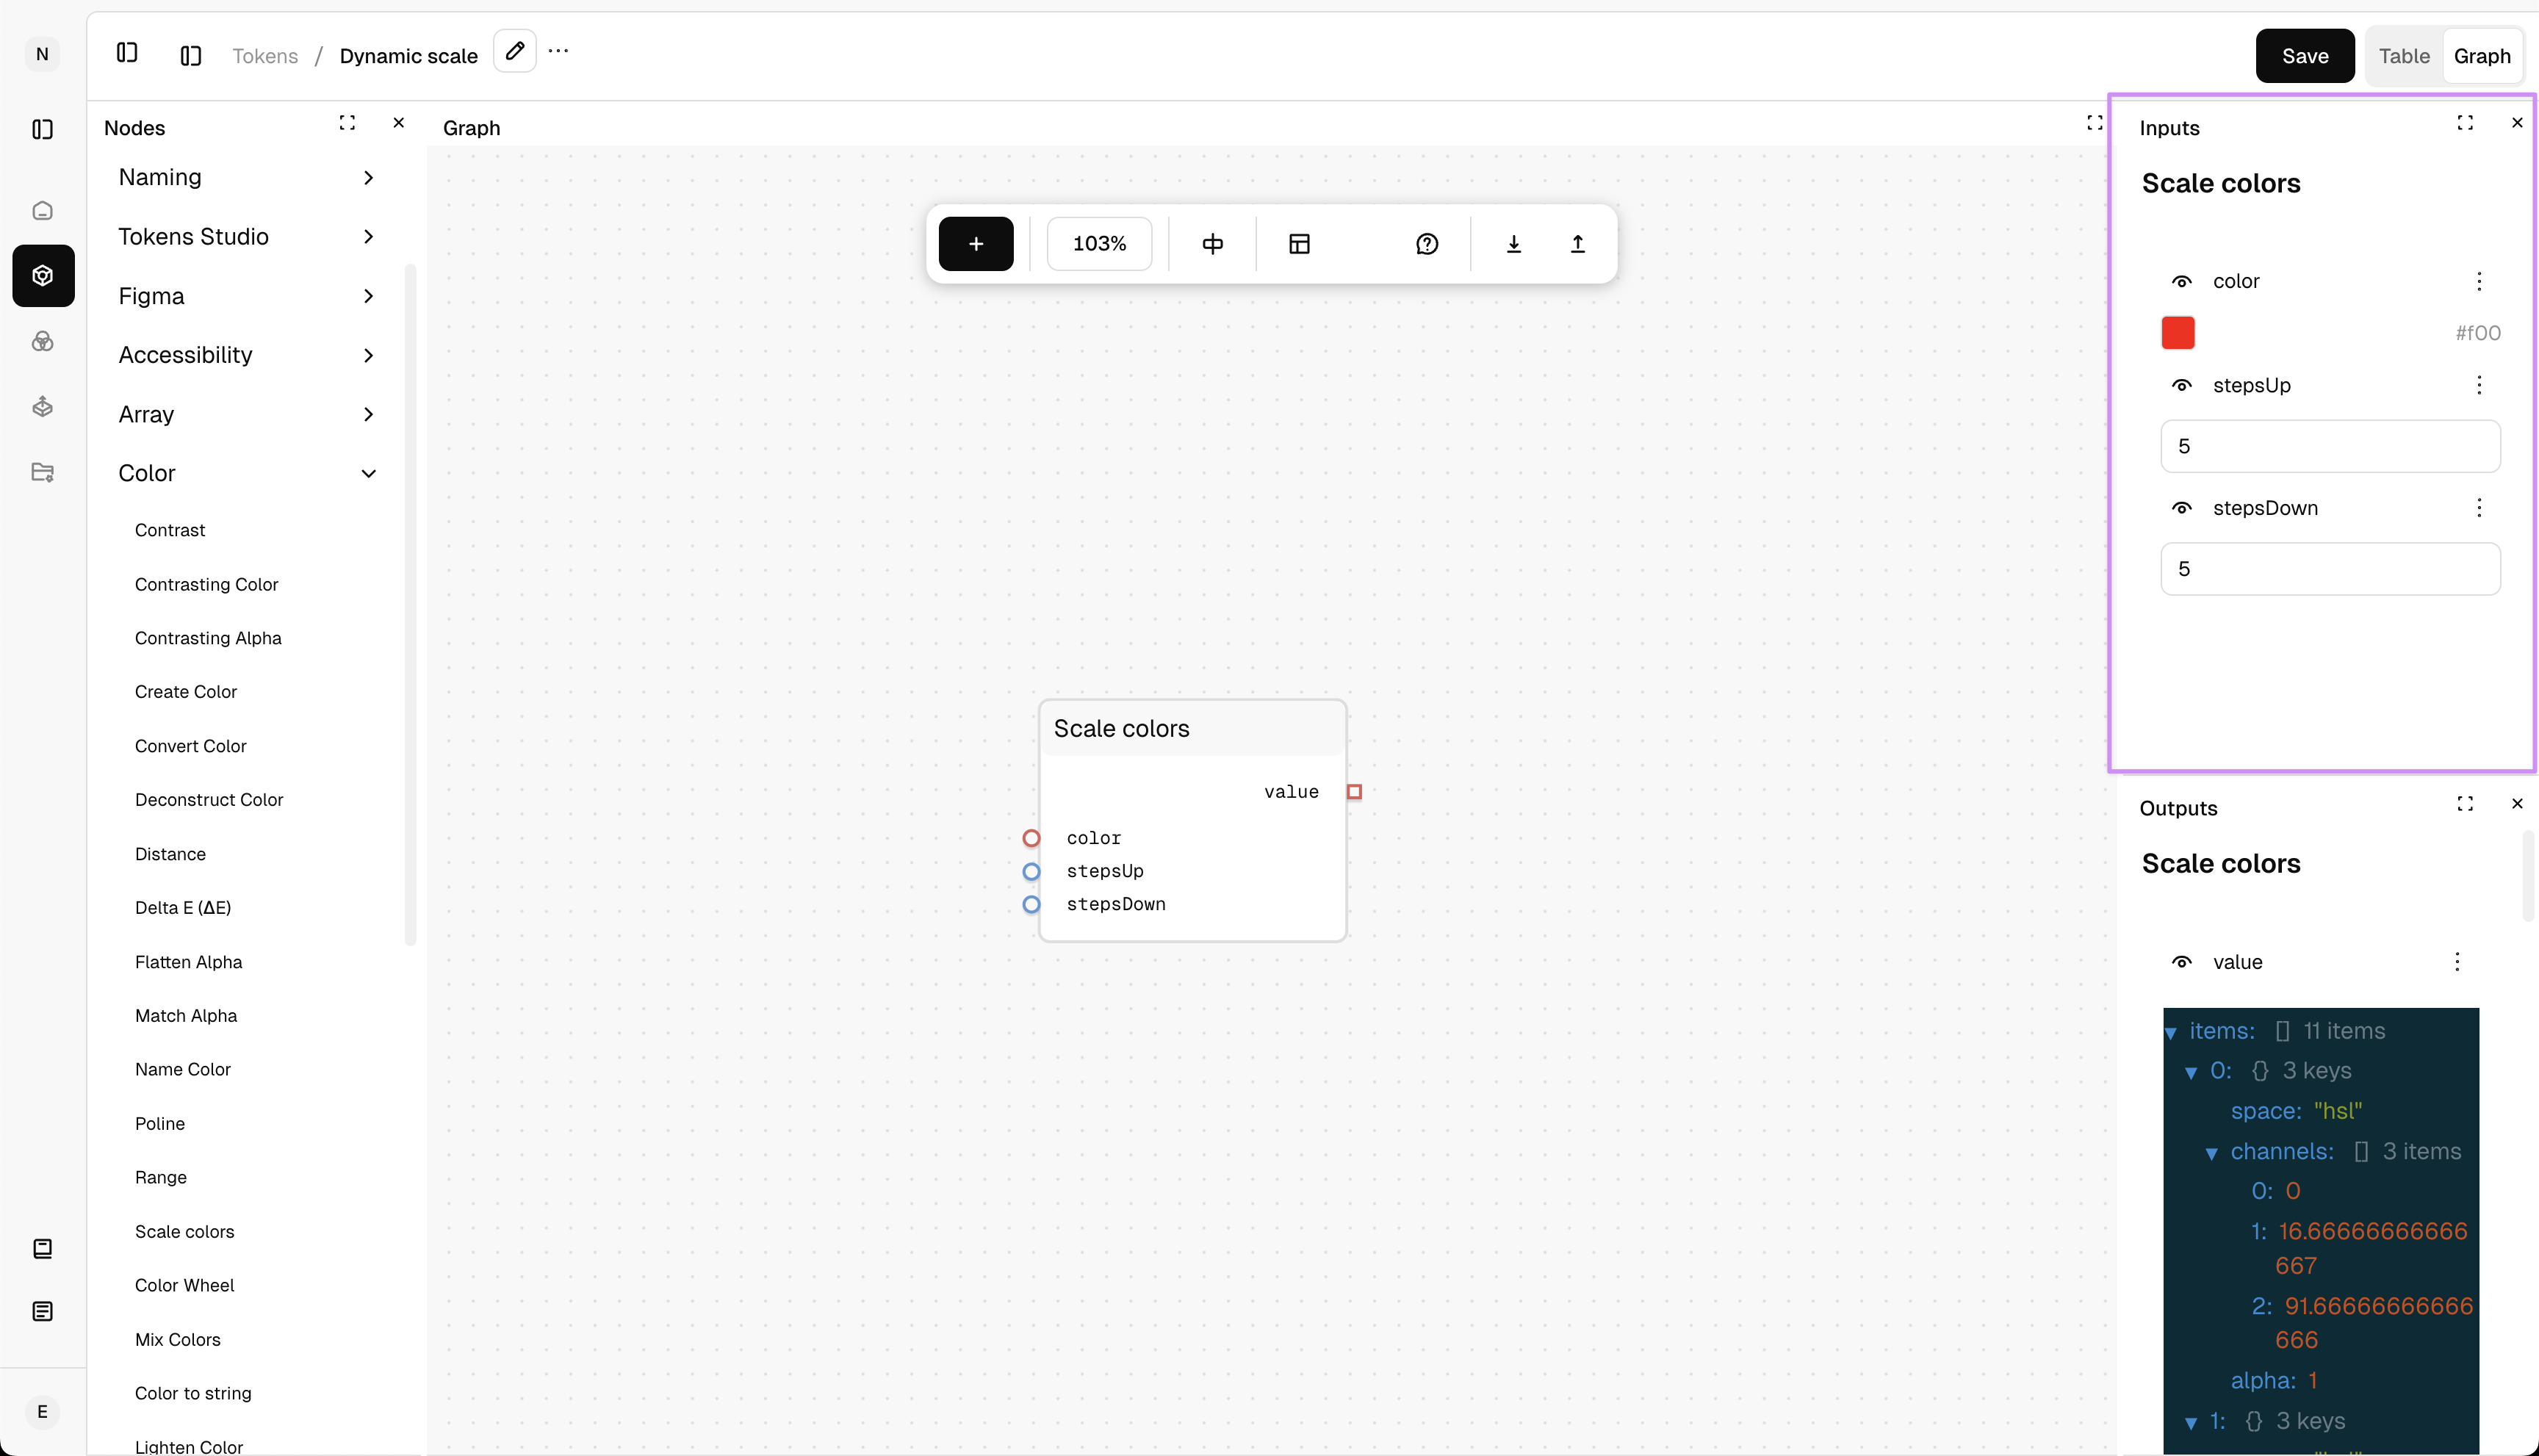
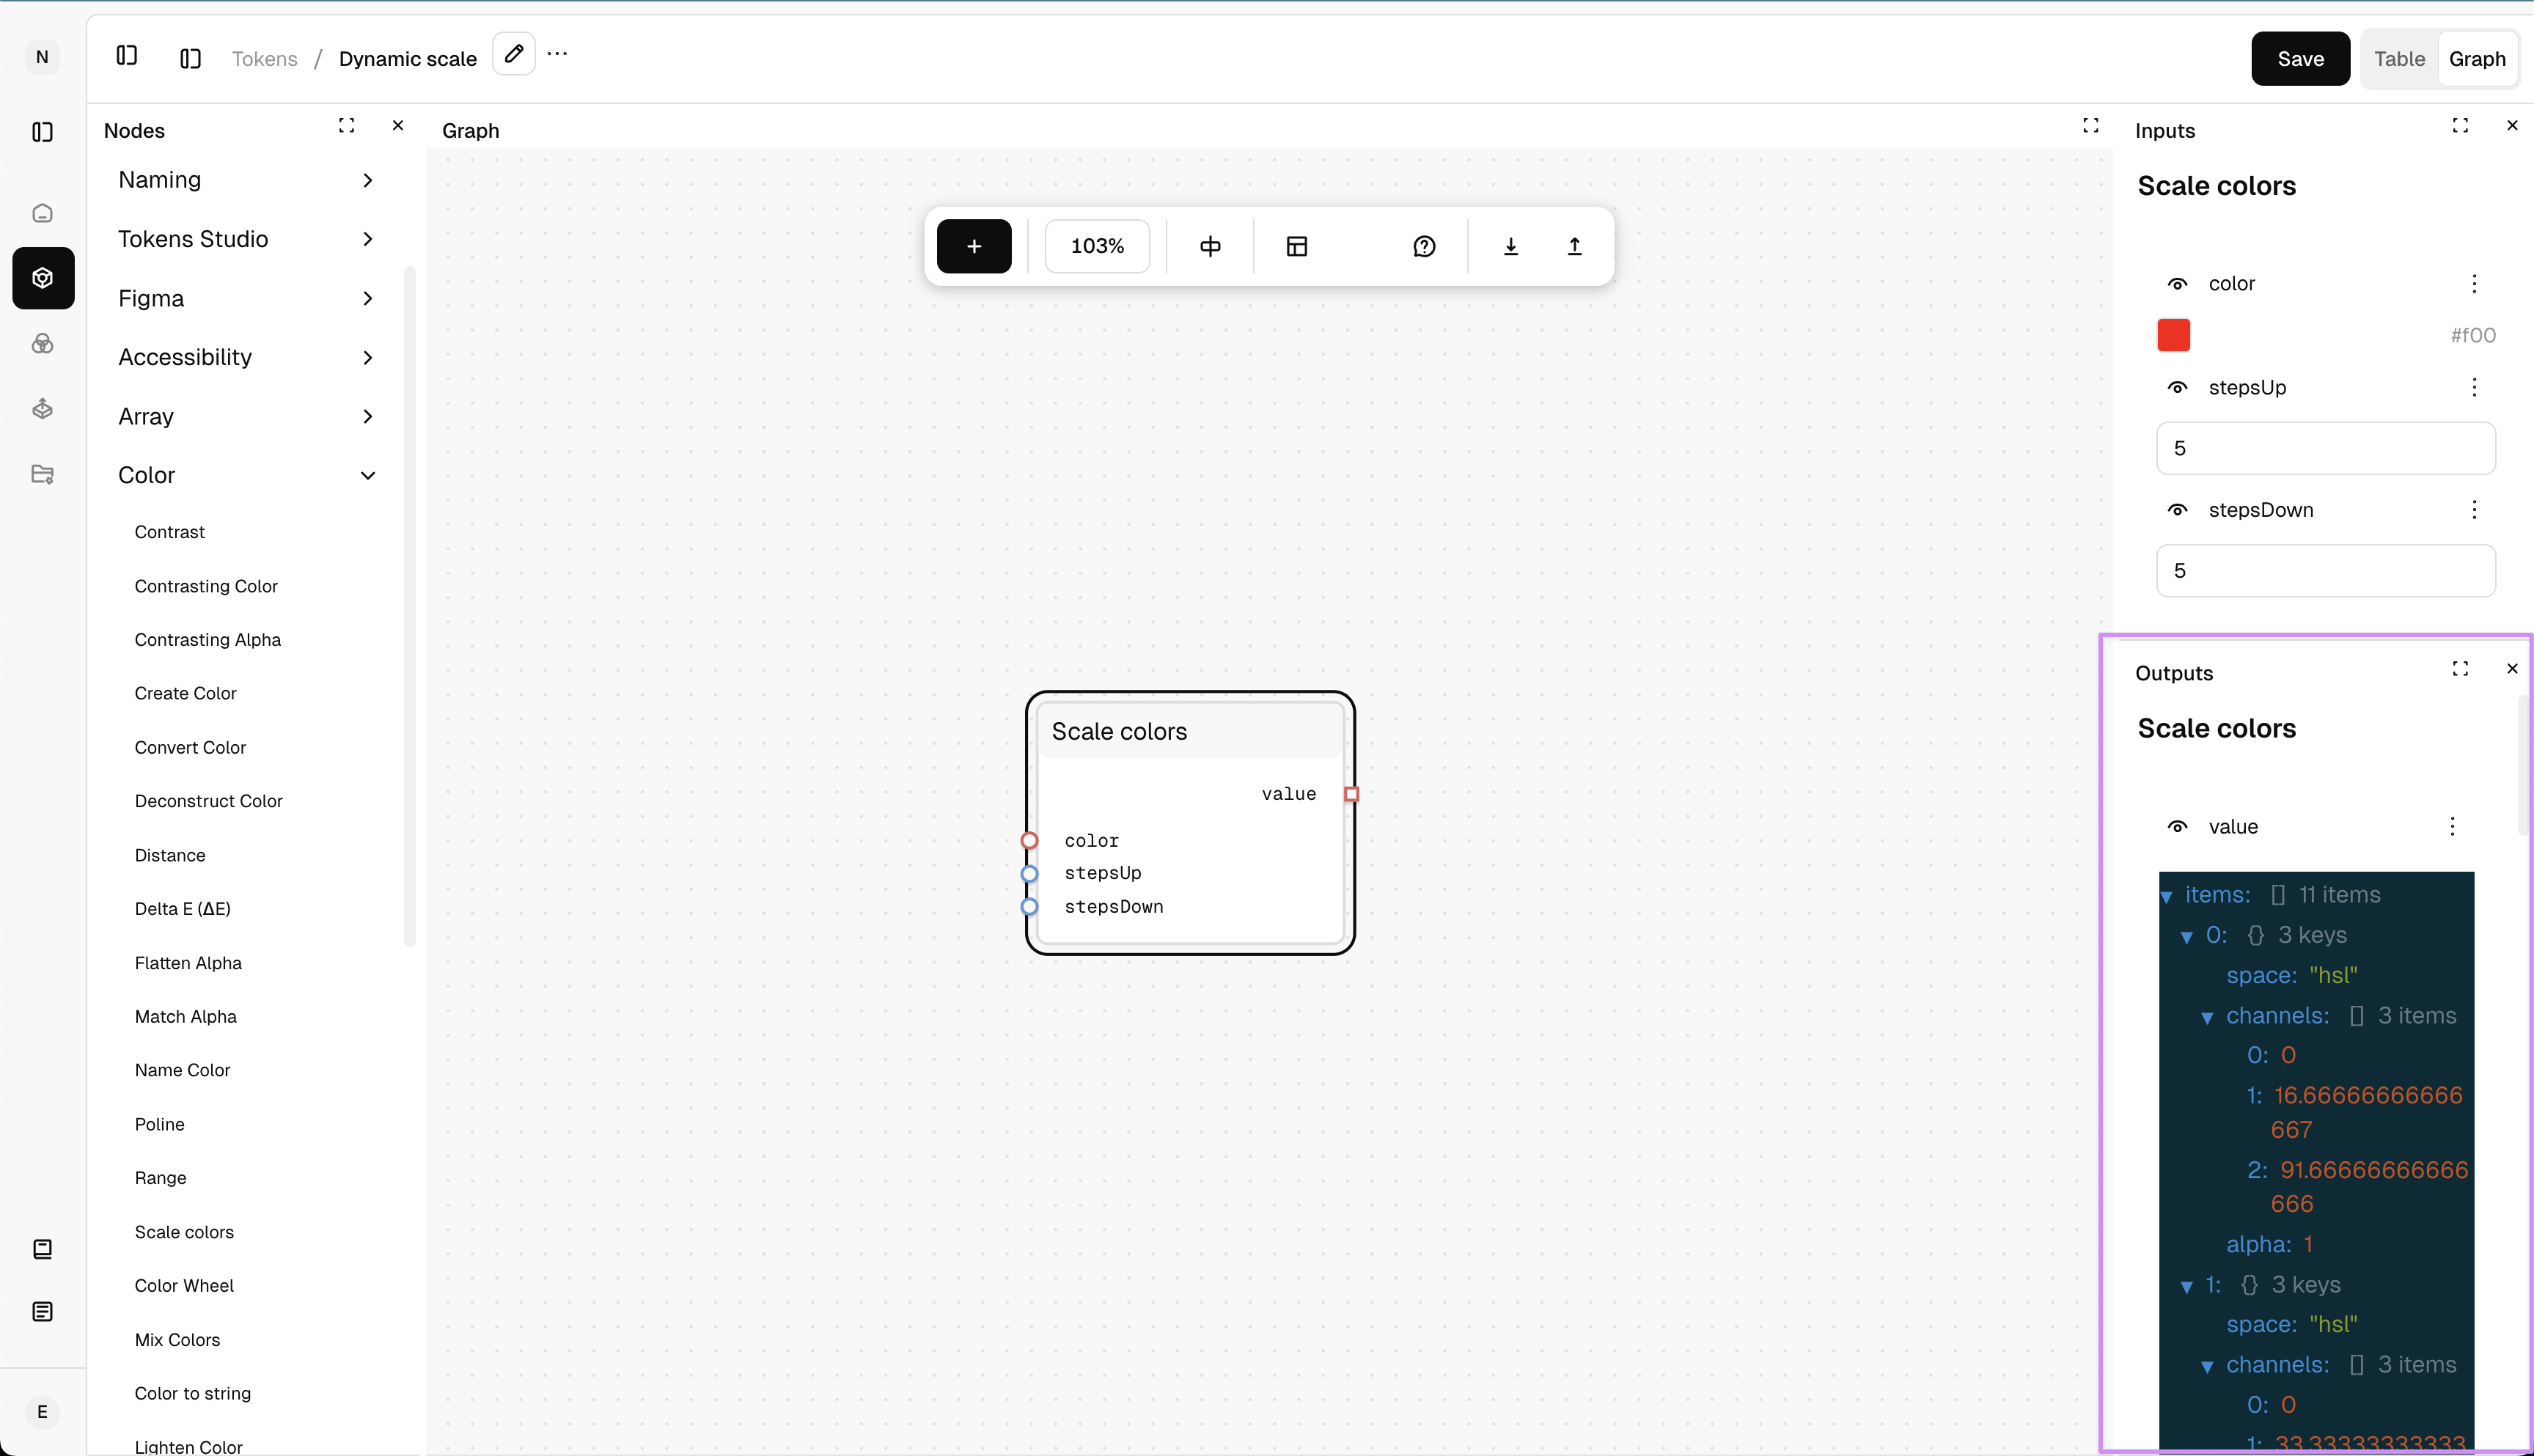
Outputs Section
- Displays all outputs for the selected node (right side of the node).
- Visualizes computed values from the node.
Graph set options
- Save - Allows you to save the progress of your graph.
- Table view - Allows you to view the design tokens created by the graph in a table view. The design tokens will not be editable in this view as they are generated by the graph.
- Graph view - The main view for editing the graph.

Customising the layout
The Graph engine UI allows you to rearrange the layout by dragging all the panels. You can either have them floating on the canvas or dock them using the arrow options that appear while dragging the panel.
To drag and reposition panels use the icon on the top right corner of each panel next to the close icon.
All the panels can be closed if not needed and can be accessed from the Top Action Bar > Layout Customisation.