Poline
What It Does
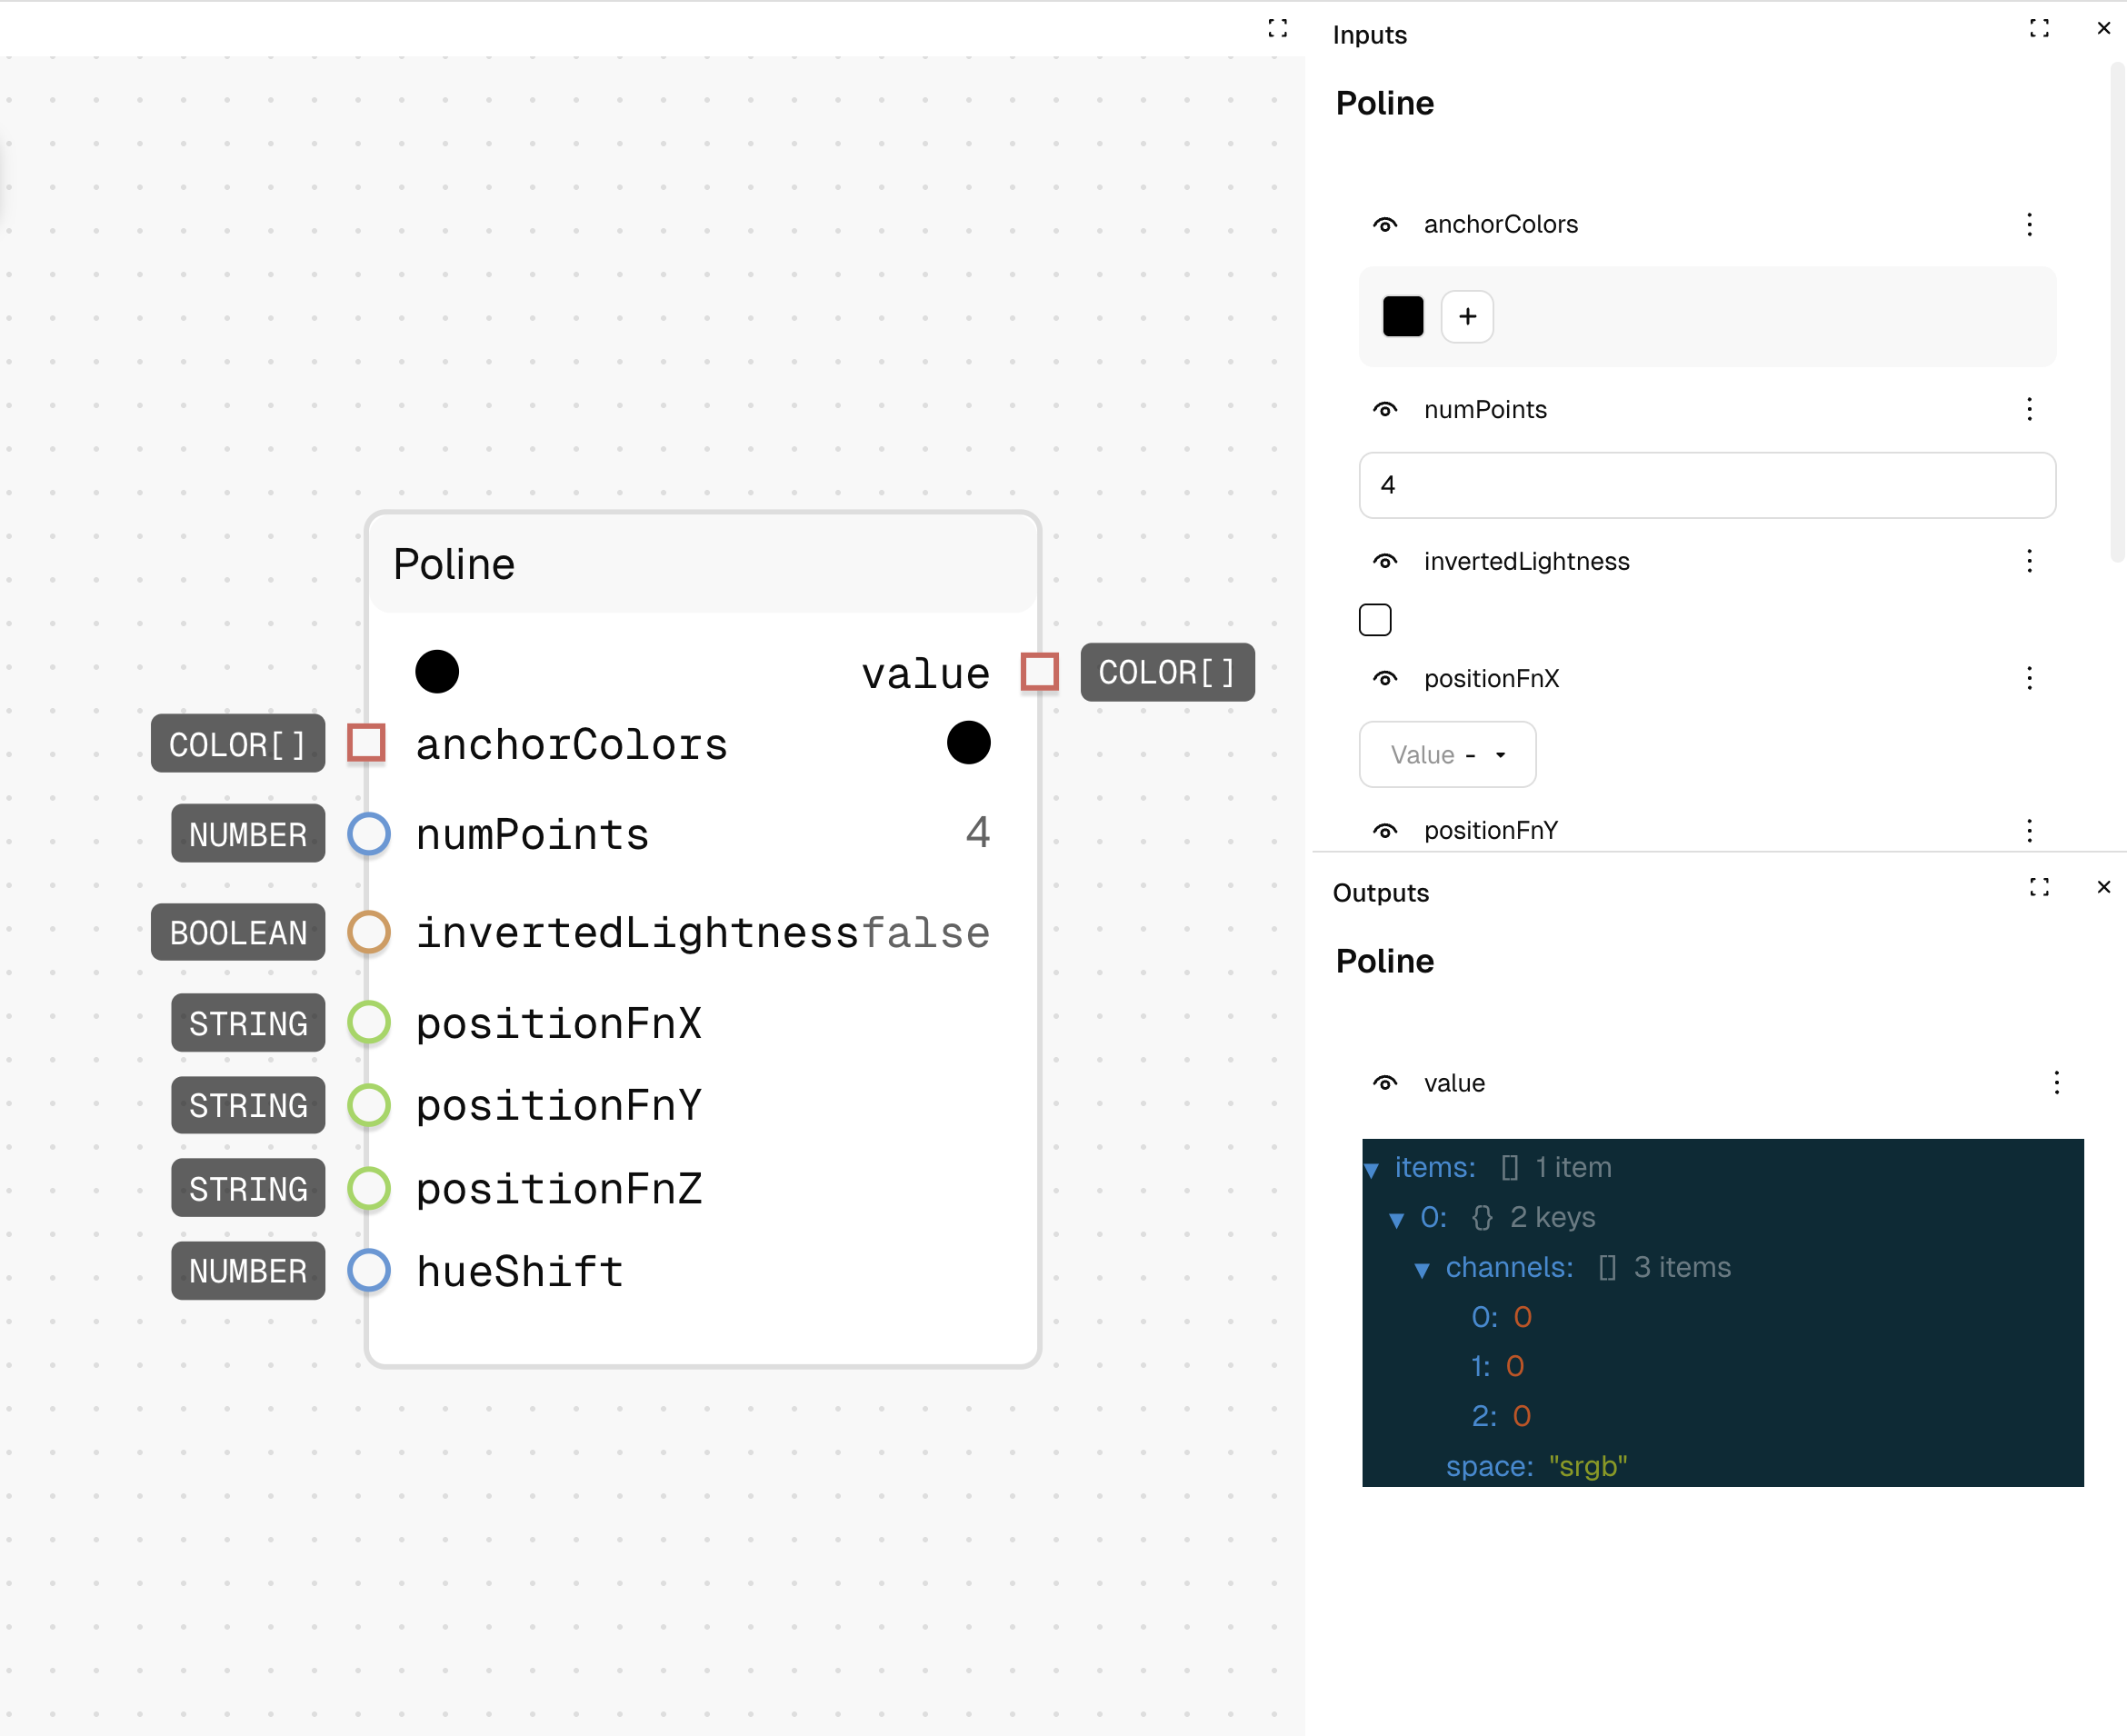
The Poline node generates a smooth color palette between multiple anchor colors using the Poline algorithm. It creates sophisticated color progressions by interpolating through 3D color space with customizable distribution functions. Read more about Poline.
Inputs
| Name | Description | Type | Required |
|---|---|---|---|
| Anchor Colors | Array of colors to interpolate between | List of Colors | Yes |
| Num Points | Number of colors to generate in the palette | Number | No |
| Inverted Lightness | Whether to invert the lightness interpolation | Yes/No | No |
| Position Fn X | Function for color distribution in the X dimension | String | No |
| Position Fn Y | Function for color distribution in the Y dimension | String | No |
| Position Fn Z | Function for color distribution in the Z dimension | String | No |
| Hue Shift | Amount to shift all hues in the resulting palette | Number | No |
Outputs
| Name | Description | Type |
|---|---|---|
| Value | Array of generated colors in the palette | List of Colors |
How to Use It
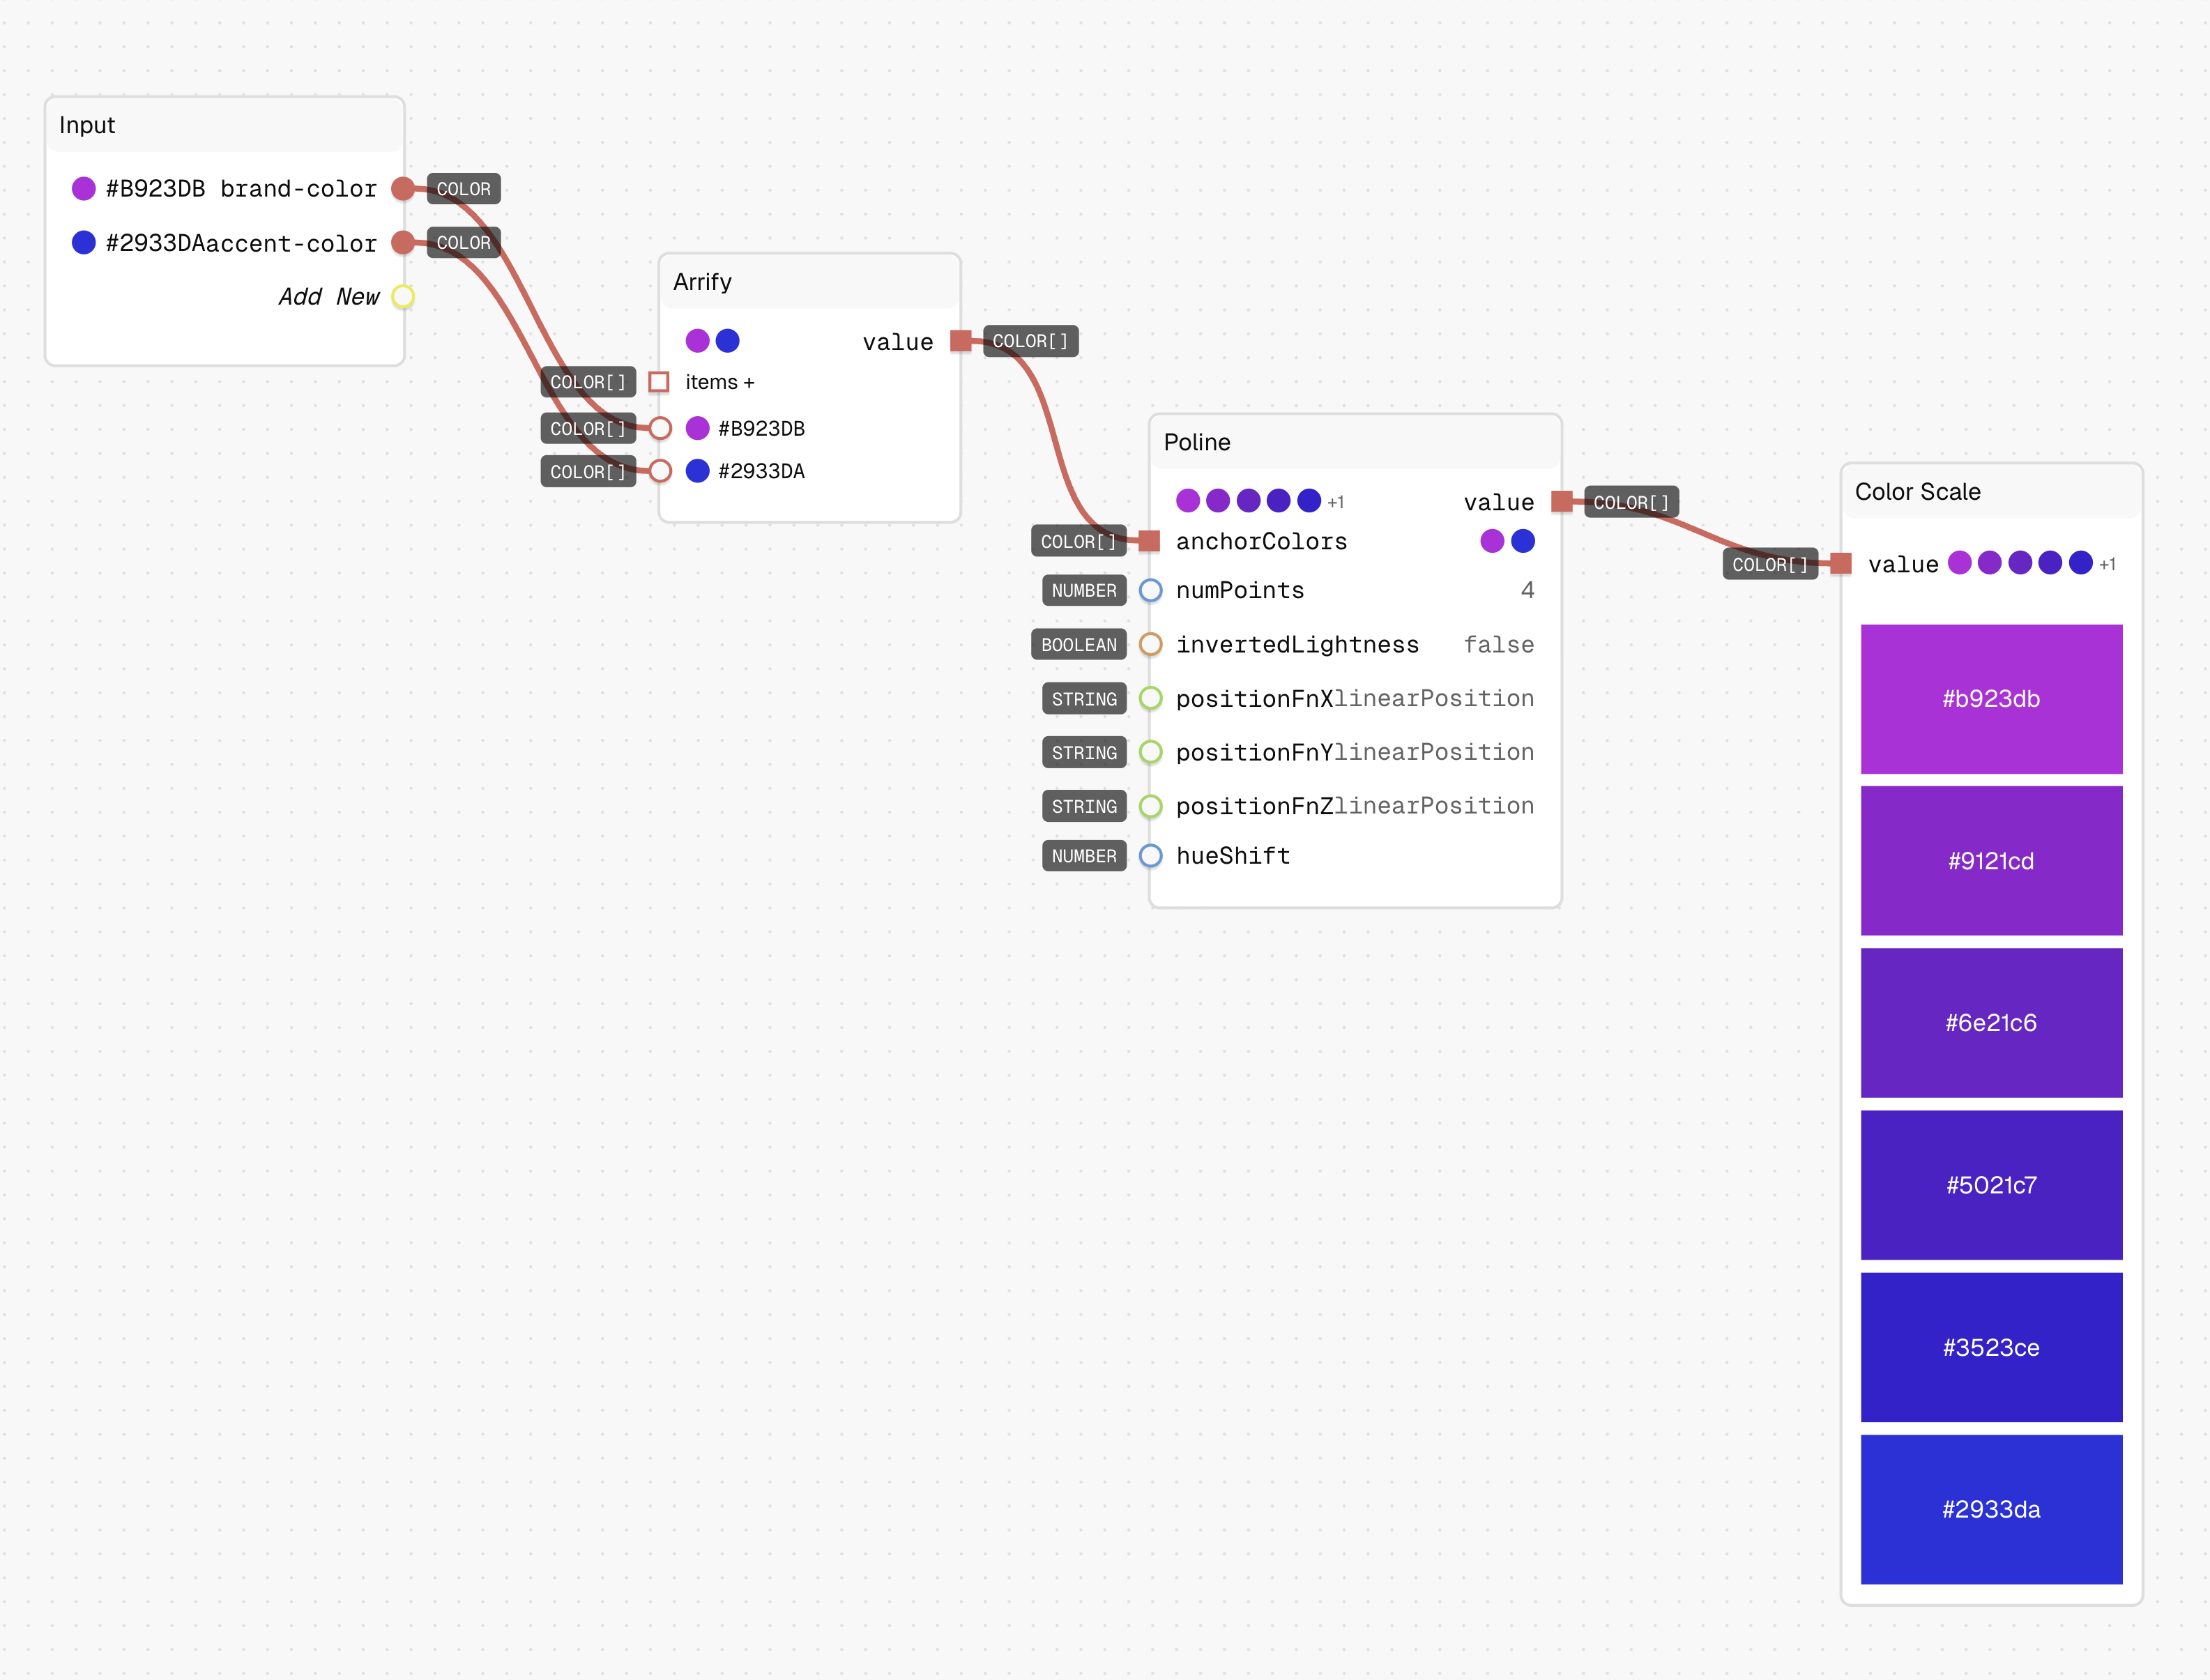
- Drag the Poline node into your graph.
- Connect at least two colors to the "Anchor Colors" input. (You can create an array of colors using the Arrify node).
- Set "Num Points" to control how many colors are in the final palette (default: 4).
- Optionally customize the position functions and other parameters. Read more about these parameters.
- The output will be an array of colors creating a smooth palette between the anchor colors. So if the input is two colors and the "Num Points" is 4, the output will be an array of six colors.
Tips
- Different position functions create different distribution patterns (sinusoidal is the default).
- More anchor colors create more complex, multi-dimensional palettes.
- Try inverting lightness to create interesting contrast variations.
See Also
- Color Wheel: For generating simpler color palettes based on color wheel relationships.
- Range: For linear interpolation between two colors.
- Scale: For creating color scales with customizable easing.
Use Cases
- Advanced Color Systems: Create sophisticated, multi-dimensional color palettes.
- Data Visualization: Generate perceptually uniform color scales for complex data.
- Design Systems: Create related but distinct color sets for different UI components.