Range Mapping
What It Does
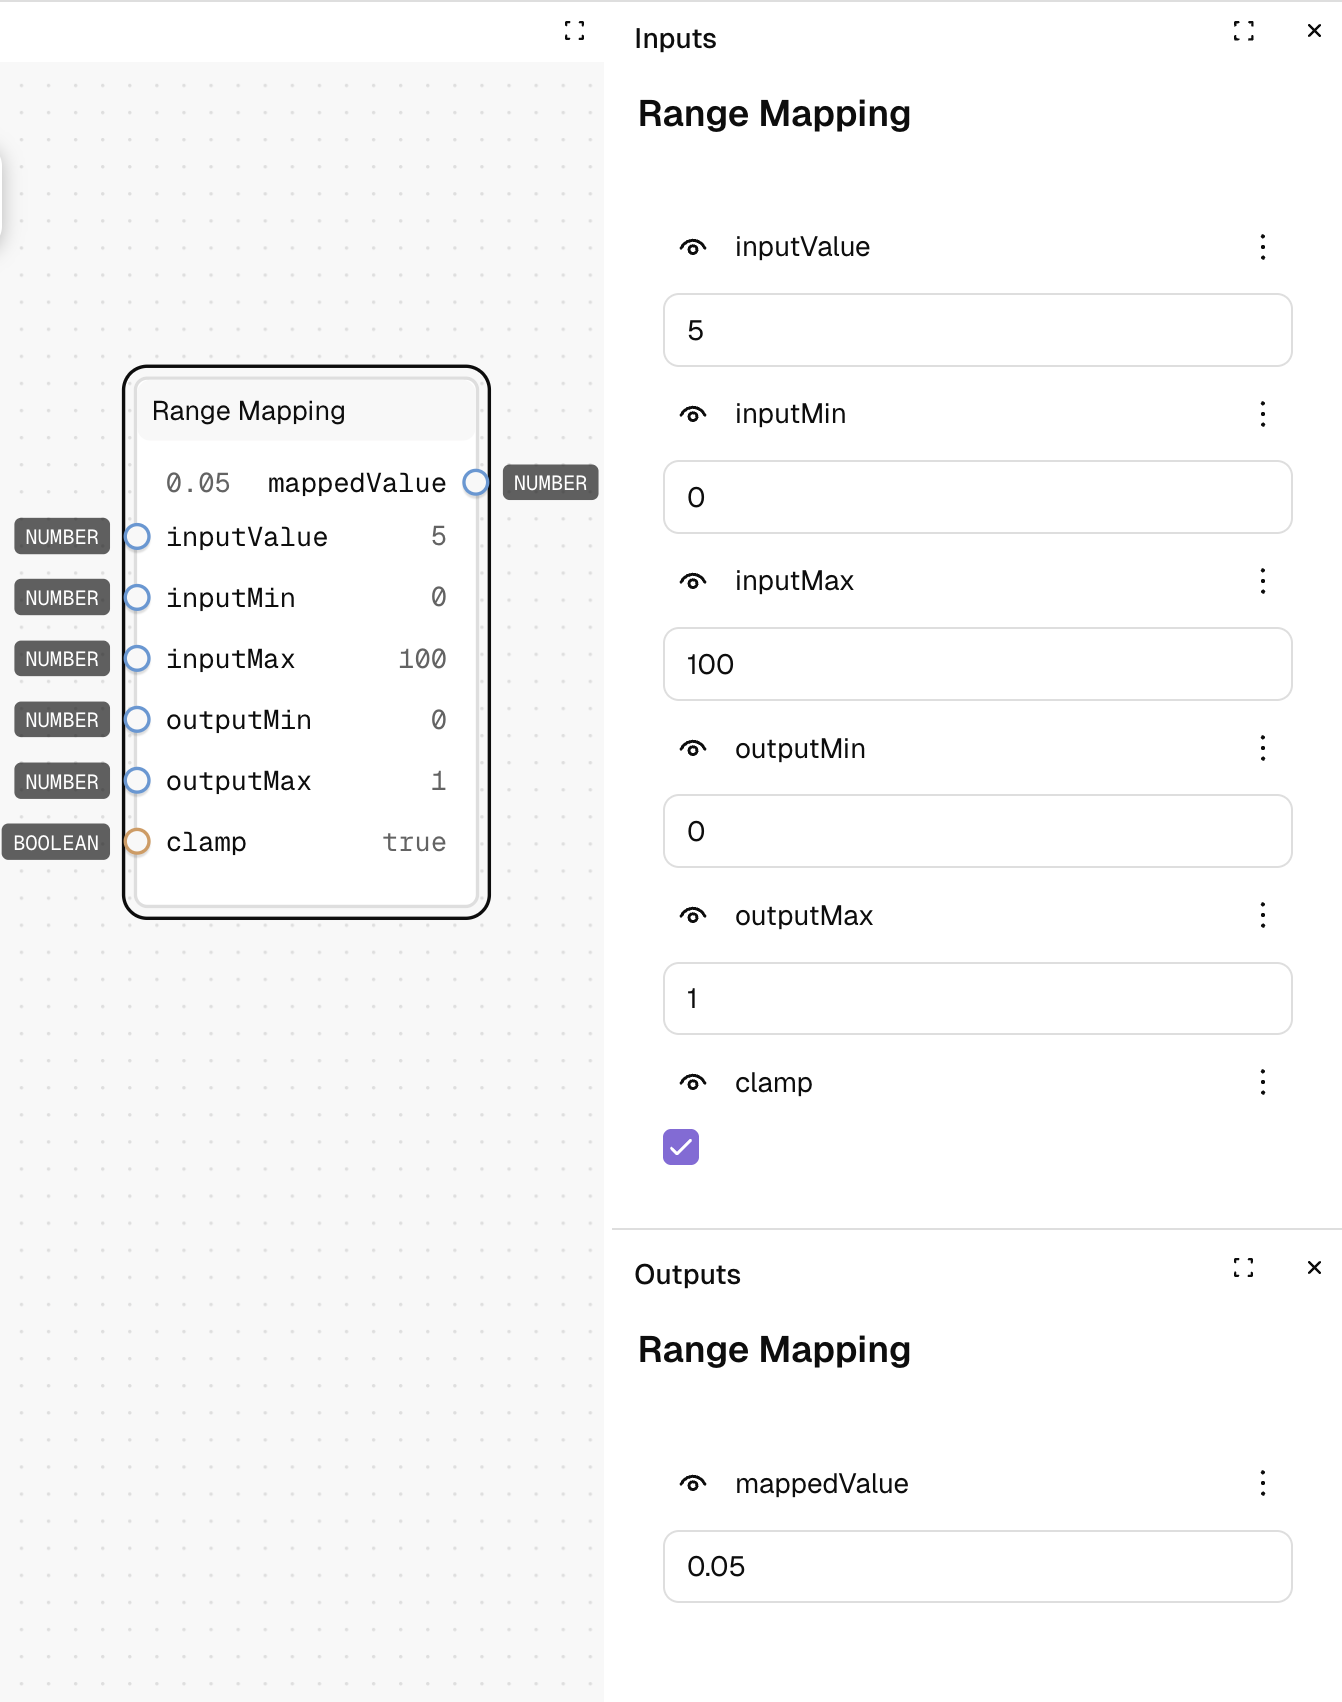
Transforms a value from one numeric range to another. It takes a value within a source range and finds the equivalent value in a target range, maintaining the same relative position.
Inputs
| Name | Description | Type | Required |
|---|---|---|---|
| inputValue | The value to transform | Number | No |
| inputMin | The minimum of the source range | Number | No |
| inputMax | The maximum of the source range | Number | No |
| outputMin | The minimum of the target range | Number | No |
| outputMax | The maximum of the target range | Number | No |
| clamp | Whether to restrict the result to the output range | Yes/No | No |
Outputs
| Name | Description | Type |
|---|---|---|
| mappedValue | The transformed value in the new range | Number |
How to Use It
- Drag the Range Mapping node into your graph.
- Set "inputValue" to the number you want to transform (e.g., 50).
- Define your source range with "inputMin" (e.g., 0) and "inputMax" (e.g., 100).
- Define your target range with "outputMin" (e.g., 0) and "outputMax" (e.g., 1).
- Choose whether to clamp the result to the output range.
- Run the graph—with the example values, your output will be 0.5 (50% of the way between 0 and 1).
Tips
- Ensure inputMin and inputMax are different values to avoid division by zero.
- The output range can be reversed (e.g., outputMin=1, outputMax=0) to invert the mapping.
- When clamp is enabled, the output will never exceed the output range boundaries.
See Also
- Lerp: For linear interpolation between two values.
- Clamp: For restricting a value within a specific range.
- Math Scale: For applying a scaling factor to a value.
Use Cases
- Responsive Design: Map screen dimensions to appropriate element sizes.
- Data Visualization: Convert raw data values to pixel coordinates for display.
- Animation Control: Transform timing values into position, opacity, or scale values.
- Normalization: Convert values from different scales into a common range (often 0-1).