Sample Float Curve
What It Does
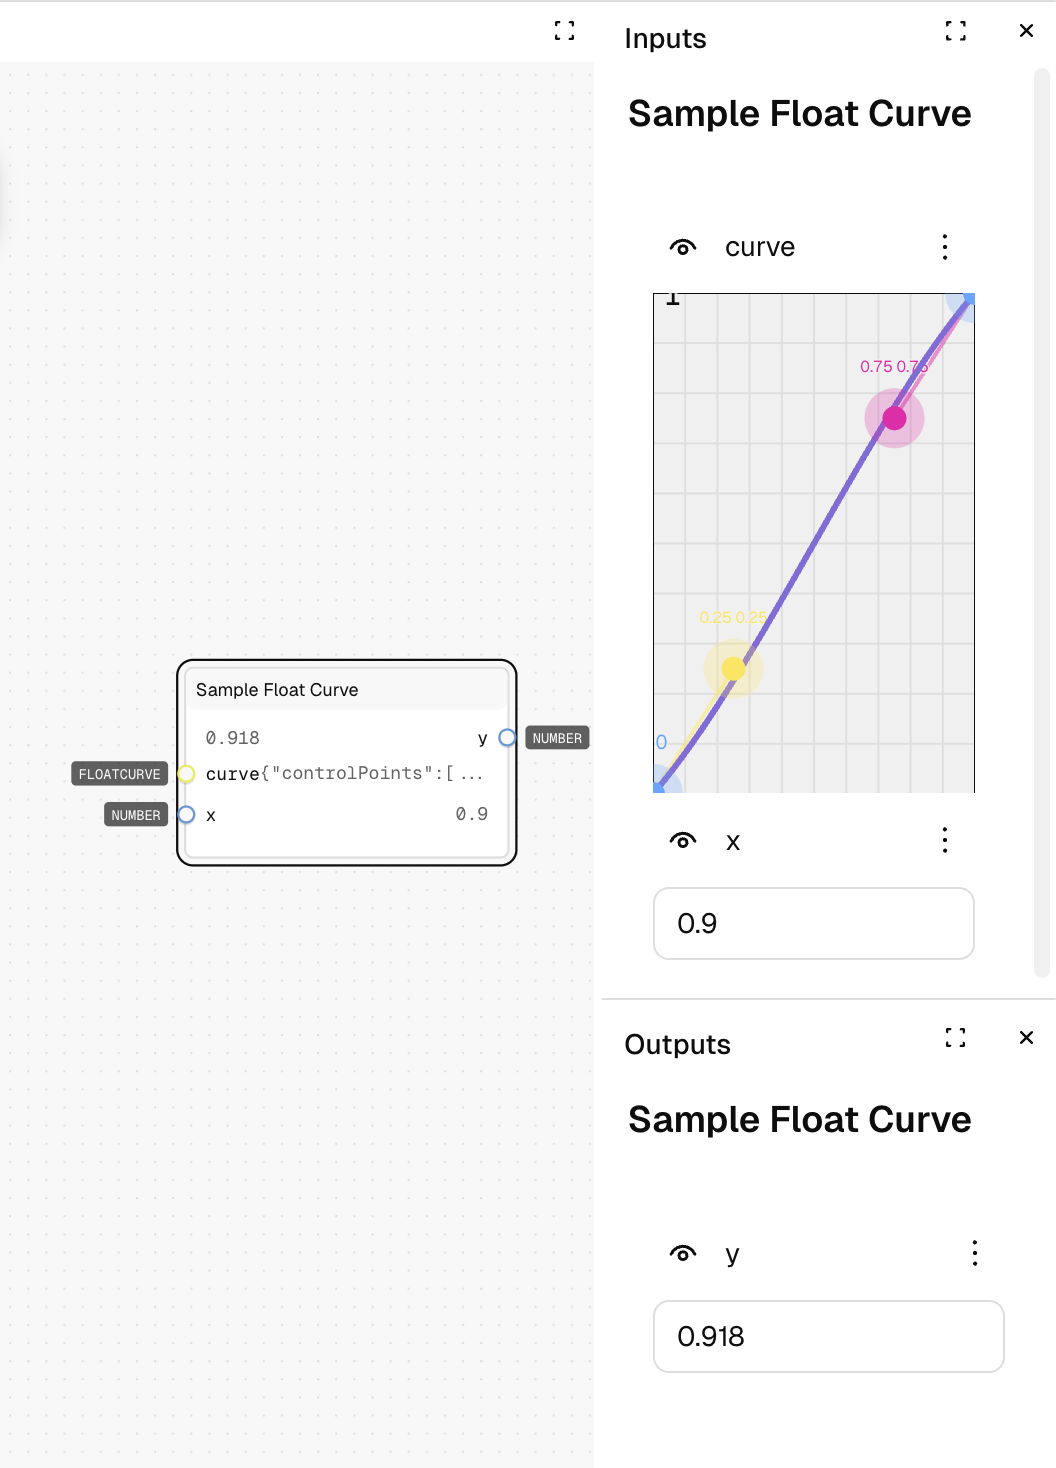
Evaluates a float curve at a specific X value and returns the corresponding Y value. This node allows you to get a precise point along a curve for interpolation or animation.
Inputs
| Name | Description | Type | Required |
|---|---|---|---|
| curve | The float curve to sample | Float Curve | Yes |
| x | The position along the curve (0-1) to sample | Number | No |
Outputs
| Name | Description | Type |
|---|---|---|
| y | The calculated value at the given position | Number |
How to Use It
- Drag the Sample Float Curve node into your graph.
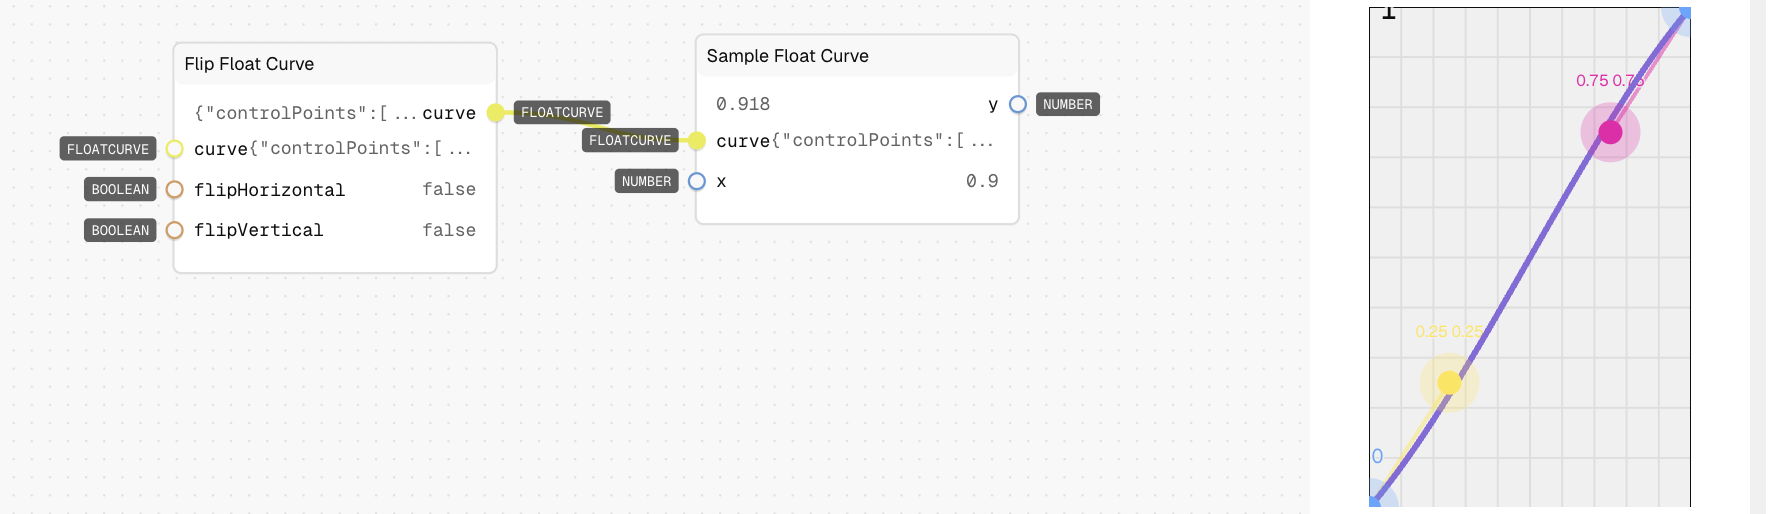
- Connect a float curve to the "curve" input.
- Set the "x" value to a number between 0 and 1 (defaults to 0).
- The node outputs the y-value at that position on the curve.
Tips
- The x value must be between 0 and 1, representing the normalized position along the curve.
- For easing functions, 0 typically represents the start and 1 represents the end of the animation.
See Also
- Sample Array from Float Curve: For sampling multiple points along a curve at once.
- Bezier Curve: For creating standard cubic bezier curves to sample.
Use Cases
- Animation Timing: Get precise intermediate values for smooth animations.
- Easing Functions: Apply custom easing to transitions between states.
- Interpolation: Calculate values between keyframes based on curved rather than linear progression.