Sample Curve
What It Does
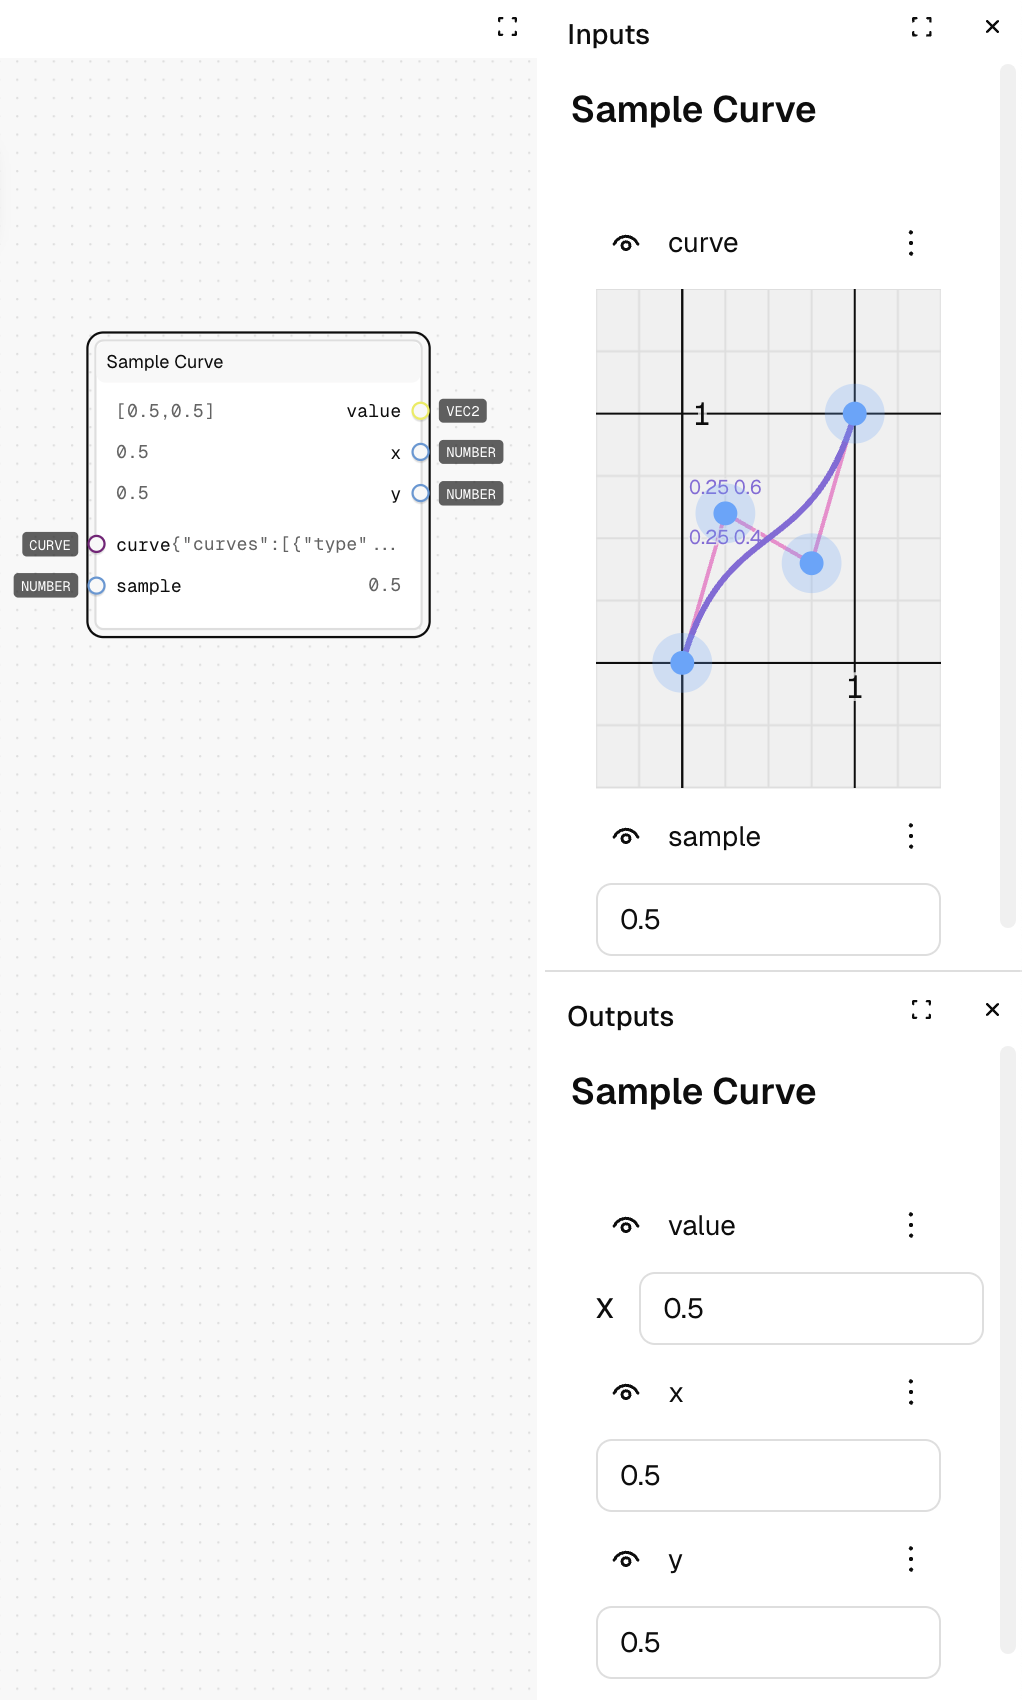
Evaluates a curve at a specific point along its length, returning the exact coordinates (x,y) at that position. This allows you to get precise values from a curve at any point between its start and end.
Inputs
| Name | Description | Type | Required |
|---|---|---|---|
| curve | The curve to sample | Curve | Yes |
| sample | The position along the curve to evaluate (0-1) | Number | No |
Outputs
| Name | Description | Type |
|---|---|---|
| value | The coordinates at the sample point as a 2D vector | Vector2 |
| x | The x-coordinate at the sample point | Number |
| y | The y-coordinate at the sample point | Number |
How to Use It
- Drag the Sample Curve node into your graph.
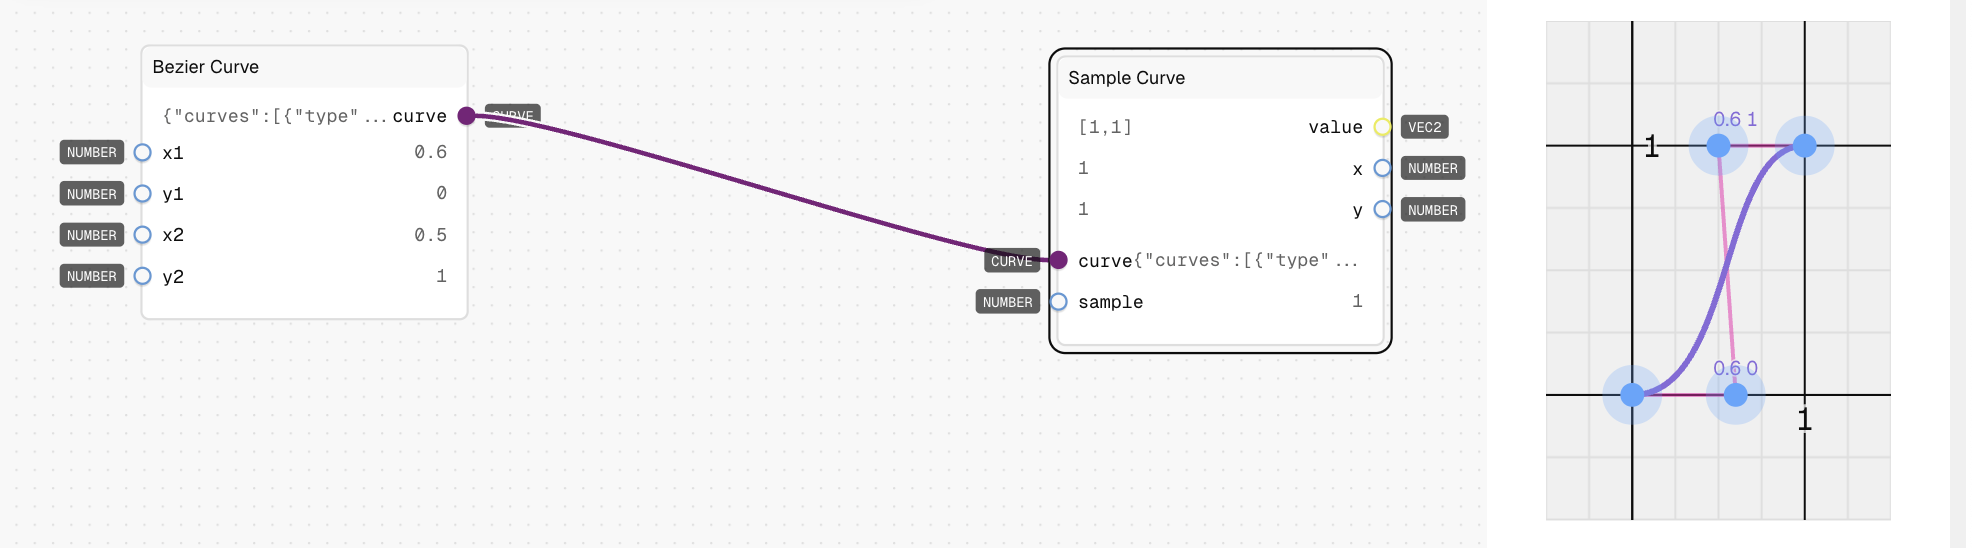
- Connect a curve (like from a Bezier Curve node) to the "curve" input.
- Set the "sample" input to a value between 0 and 1 (default is 0.5, which is the middle of the curve).
- Run the graph—the outputs will be the coordinates at that point on the curve.
- For a standard Bezier with default control points, at sample=0.5, you might get value=[0.5, 0.5]
Tips
- The sample value represents the progression along the curve, where 0 is the start and 1 is the end.
- For Bezier curves, the sample doesn't directly correspond to x-coordinates—a sample of 0.5 might not give you an x-coordinate of 0.5 due to the curve's shape.
- Use this node to map progress (0-1) to actual coordinate values along a curve.
See Also
- Bezier Curve: For creating curves that can be sampled.
- Preset Beziers: For commonly used predefined curves.
- Float Curve: For more complex curve definitions.
Use Cases
- Animation Paths: Calculate positions along a curved path for smooth movement.
- Easing Functions: Convert linear progress to eased values for natural animations.
- Data Visualization: Map data points to curved representations instead of straight lines.