Preview Curve
What It Does
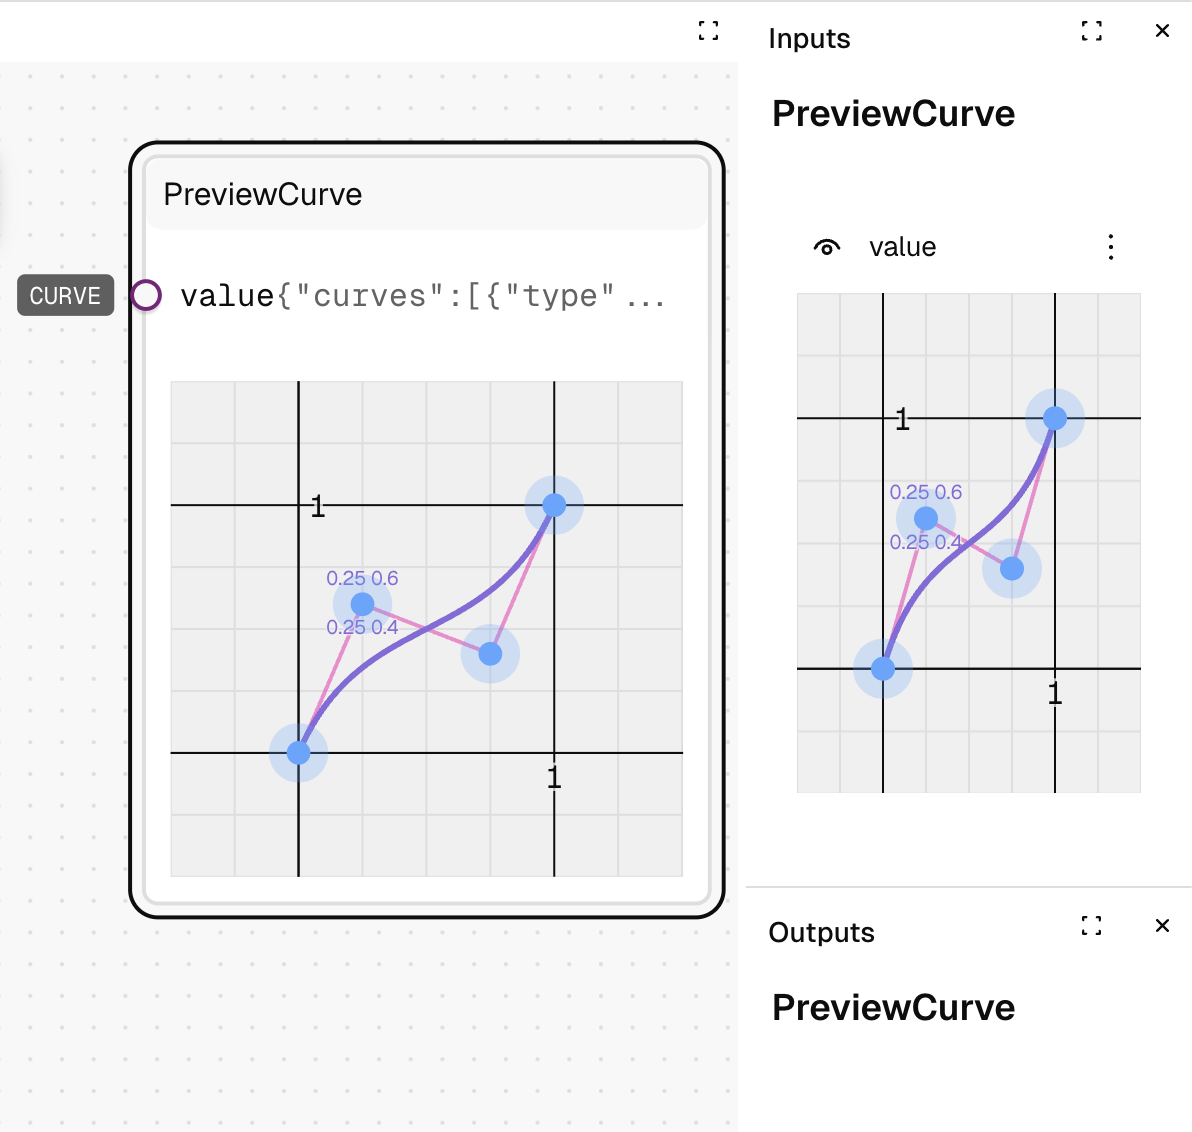
The PreviewCurve node visualizes a curve or function as a graph. It helps you see the shape and behavior of mathematical curves for animation or interpolation.
Inputs
| Name | Description | Type | Required |
|---|---|---|---|
| Value | The curve to visualize | Curve | Yes |
Outputs
| Name | Description | Type |
|---|---|---|
| No outputs | This node is for preview purposes only | - |
How to Use It
- Drag the PreviewCurve node into your graph.
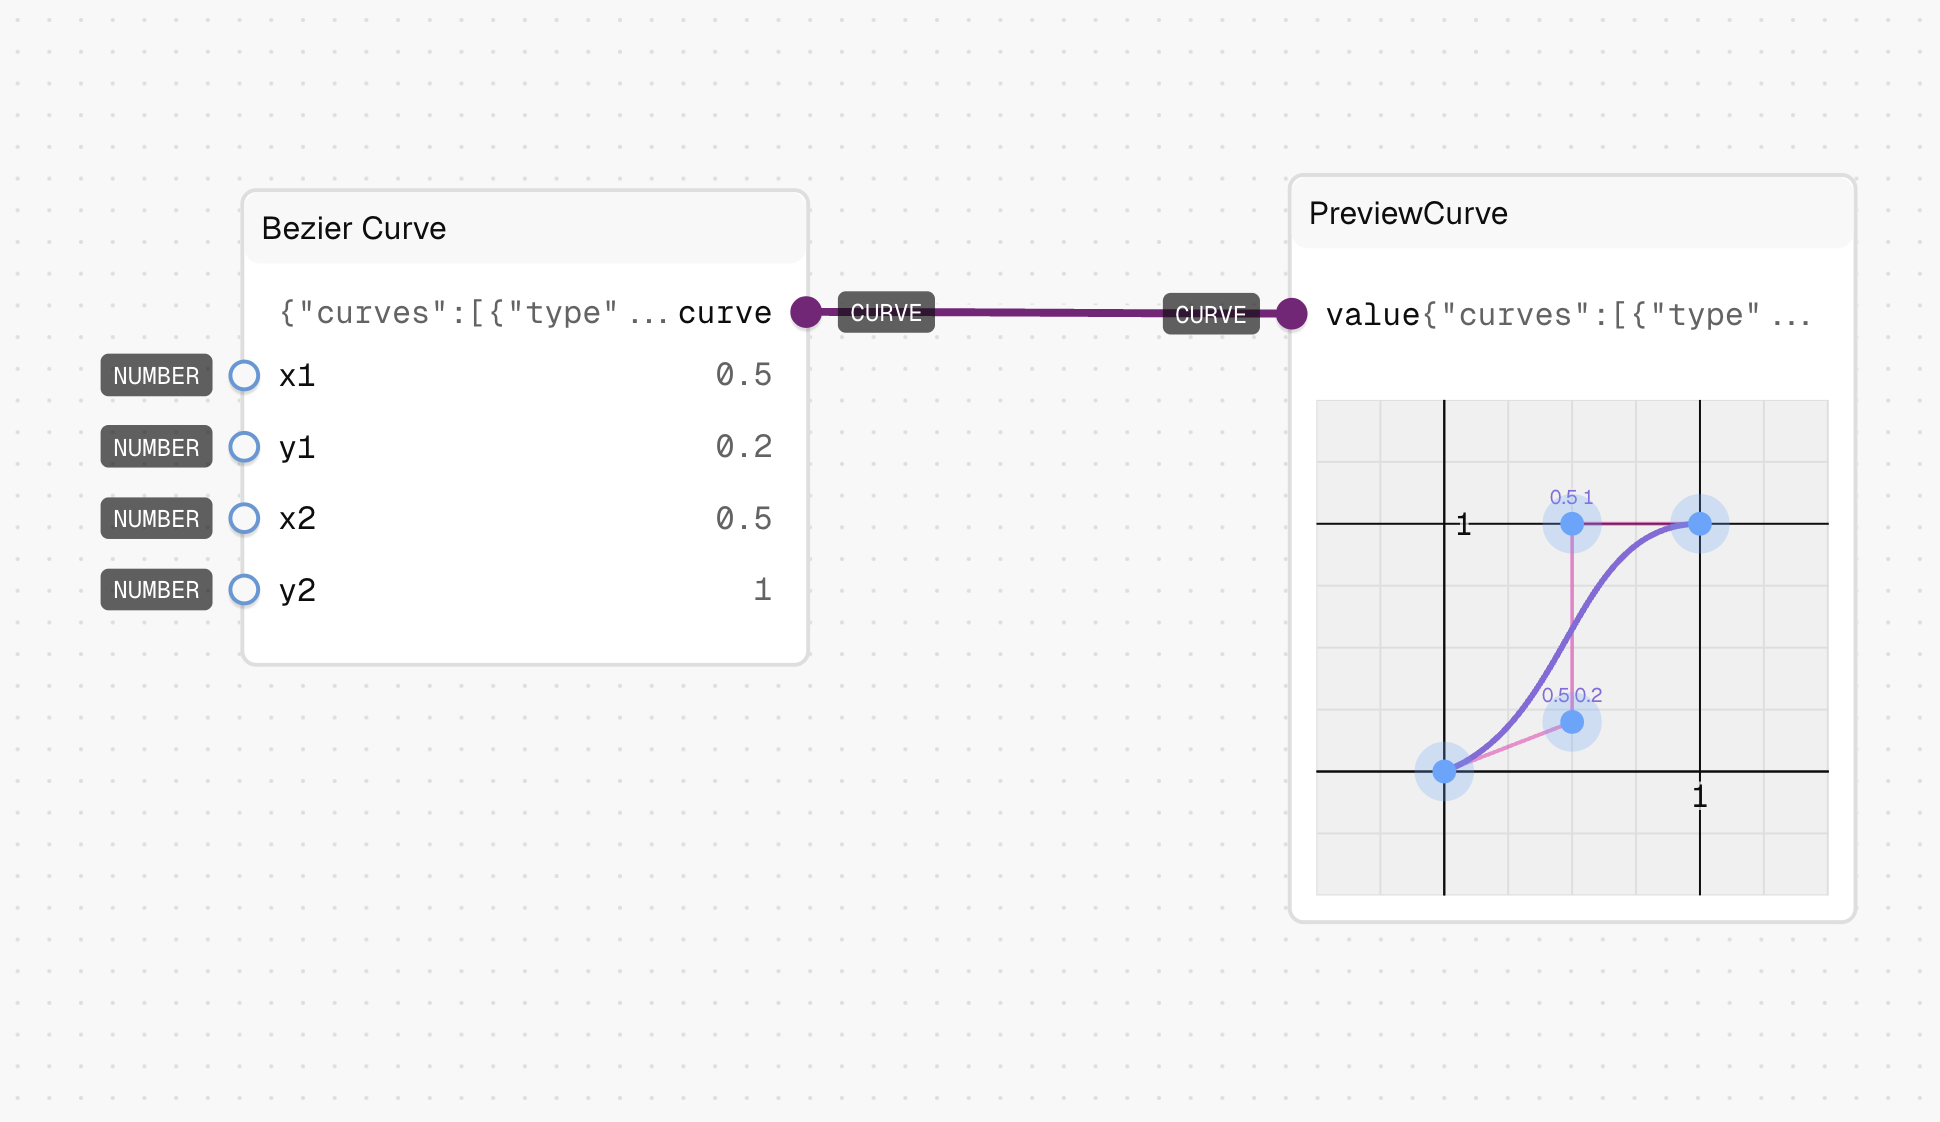
- Connect a curve value (like a Bezier curve or other function curve) to the "Value" input.
- The node will display a graphical representation of the curve's shape.
- Use the visualization to understand the curve's progression and behavior.
Tips
- Use this to verify the shape of easing curves for animations.
- Check transition curves to ensure they have the intended acceleration and deceleration.
See Also
- Bezier Curve: For creating custom curves to preview.
- Preset Bezier Curves: For selecting from common curve types.
Use Cases
- Animation Curves: Visualize easing functions for animation timing.
- Interpolation Preview: See how values will transition between points.
- Function Validation: Verify that mathematical functions produce the expected curve shape.