Studio
  • Why Studio?
  • Getting Started
  • Setting up Studio
    • Import from Tokens Studio for Figma
    • Import from Figma variables
  • Connect Studio to Figma
    • Using Tokens Studio for Figma
    • Using Companion by Tokens Studio
  • Connect Studio to Code
  • Platform
    • Features
      • Tokens
        • Token Sets
        • Token flow
      • Themes
        • Theme Groups and Theme Options
      • Configuration
      • Releases
    • Platform
      • Accounts
      • Organisation
      • Project
      • API keys
      • Inviting members
  • GRAPH ENGINE
    • Introduction
    • Editor
    • Creating a Graph Based Set
    • Nodes
    • Types
    • Editing
    • Available Nodes
      • Accessibility
        • Color Blindness
      • Array
        • Array Filter
        • Array Find
        • Arrify
        • Concat
        • Flatten
        • Index Array
        • Inject Item
        • Array Length
        • Array Push
        • Remove Item
        • Replace Item
        • Reverse Array
        • Slice Array
        • Sort Array
        • Array Map
      • Color
        • Color To String
        • Color Wheel
        • Contrast
        • Contrasting Alpha
        • Contrasting Color
        • Contrasting from Array
        • Convert Color
        • Create Color
        • Darken Color
        • Deconstruct Color
        • Delta E
        • Distance
        • Flatten Alpha
        • Lighten Color
        • Match Alpha
        • Mix Colors
        • Name Color
        • Poline
        • Range
        • Scale Colors
        • Sort Colors By Distance
        • String To Color
      • CSS
        • CSS Accessible Clamp
        • CSS Box
        • CSS Function
        • CSS Map
      • Curves
        • Bezier Curve
        • Construct Float Curve
        • Deconstruct Float Curve
        • Flip Float Curve
        • Preset Bezier Curves
        • Sample Array from Float Curve
        • Sample Curve
        • Sample Float Curve
      • Design Tokens
        • Array To Set
        • Create Border
        • Create Border Design Token
        • Create Box Shadow
        • Create Box Shadow Design Token
        • Create Design Token
        • Create Reference
        • Create Typography
        • Create Typography Design Token
        • Destruct Token
        • External Token Set
        • Extract Token
        • Flatten Token Sets
        • Group Tokens
        • Inline Tokens
        • Invert Token Set
        • Leonardo Color
        • Leonardo Theme
        • Name Tokens
        • Preview Typography
        • Resolve Tokens
        • Set To Array
        • Ungroup Tokens
        • Group Token Array
        • Ungroup Token Array
      • Figma
        • Code Syntax
        • Publish Varibales
        • Scope All
        • Scope by Type
        • Scope Color
        • Scope Number
        • Scope String
      • Generic
        • Constant
        • Delay
        • Input
        • Object Merge
        • Note
        • Object Path
        • Objectify
        • Output
        • Panic
        • Passthrough
        • Subgraph
        • Time
      • Gradient
        • Gradient Stop
      • Logic
        • And
        • Compare
        • If
        • Not
        • Or
        • Switch
      • Math
        • Absolute
        • Add
        • Add Variadic
        • Ceiling
        • Clamp
        • Closest Number
        • Cosine
        • Count
        • Difference
        • Divide
        • Divide Variadic
        • Evaluate Math
        • Exponentiation
        • Floor
        • Fluid
        • Lerp
        • Modulo
        • Multiply
        • Multiply Variadic
        • Power
        • Random
        • Range Mapping
        • Round
        • Sine
        • Snap
        • Square Root
        • Subtract
        • Subtract Variadic
        • Tangent
      • Preview
        • Color Compare
        • Color Scale
        • Color Swatch
        • Math Expression
        • Number
        • Preview Curve
      • Search
        • Find First Match
        • Linear Search
      • Series
        • Alternating Series
        • Arithmetic Series
        • Exponential Decay
        • Fibonacci Series
        • Geometric Series
        • Harmonic Series
        • Inverse Linear Mapping
        • Linear Space
        • Power Series
      • String
        • Case Convert
        • Interpolation
        • Join Array
        • Lowercase
        • Normalize
        • Pad
        • Regex
        • Replace
        • Split String
        • Stringify
        • Uppercase
      • Typography
        • Base Font Size
      • Typing
        • Assert Defined
        • Has Value
        • Parse Number
        • Parse Unit
        • Pass Unit
      • Vector2
        • Create
        • Destructure
      • Naming
        • Alphabetic Scale
        • Alphanumeric Scale
        • Greek Letter
        • Hierarchy Level
        • Numeric Scale
        • T-Shirt Size
  • PLUGINS
    • Tokens Studio for Figma Plugin
    • Companion by Tokens Studio
    • Tokens Studio for Framer Plugin
Powered by GitBook
On this page
  • What It Does
  • Inputs
  • Outputs
  • How to Use It
  • Tips
  • See Also
  • Use Cases
Edit on GitHub
  1. GRAPH ENGINE
  2. Available Nodes
  3. Series

Exponential Decay

PreviousArithmetic SeriesNextFibonacci Series

Last updated 26 days ago

What It Does

Generates a sequence of values that decrease according to the exponential decay formula P*e^(-kx). This creates a curve that starts at an initial value and rapidly decreases at first, then tapers off gradually.

Inputs

Name
Description
Type
Required

initialValue

The starting value (P)

Number

No

length

Number of values to generate

Number

No

decayRate

The rate of decay (k)

Number

No

precision

Number of decimal places to round to

Number

No

Outputs

Name
Description
Type

values

The sequence of decreasing values

List

How to Use It

  1. Drag the Exponential Decay node into your graph.

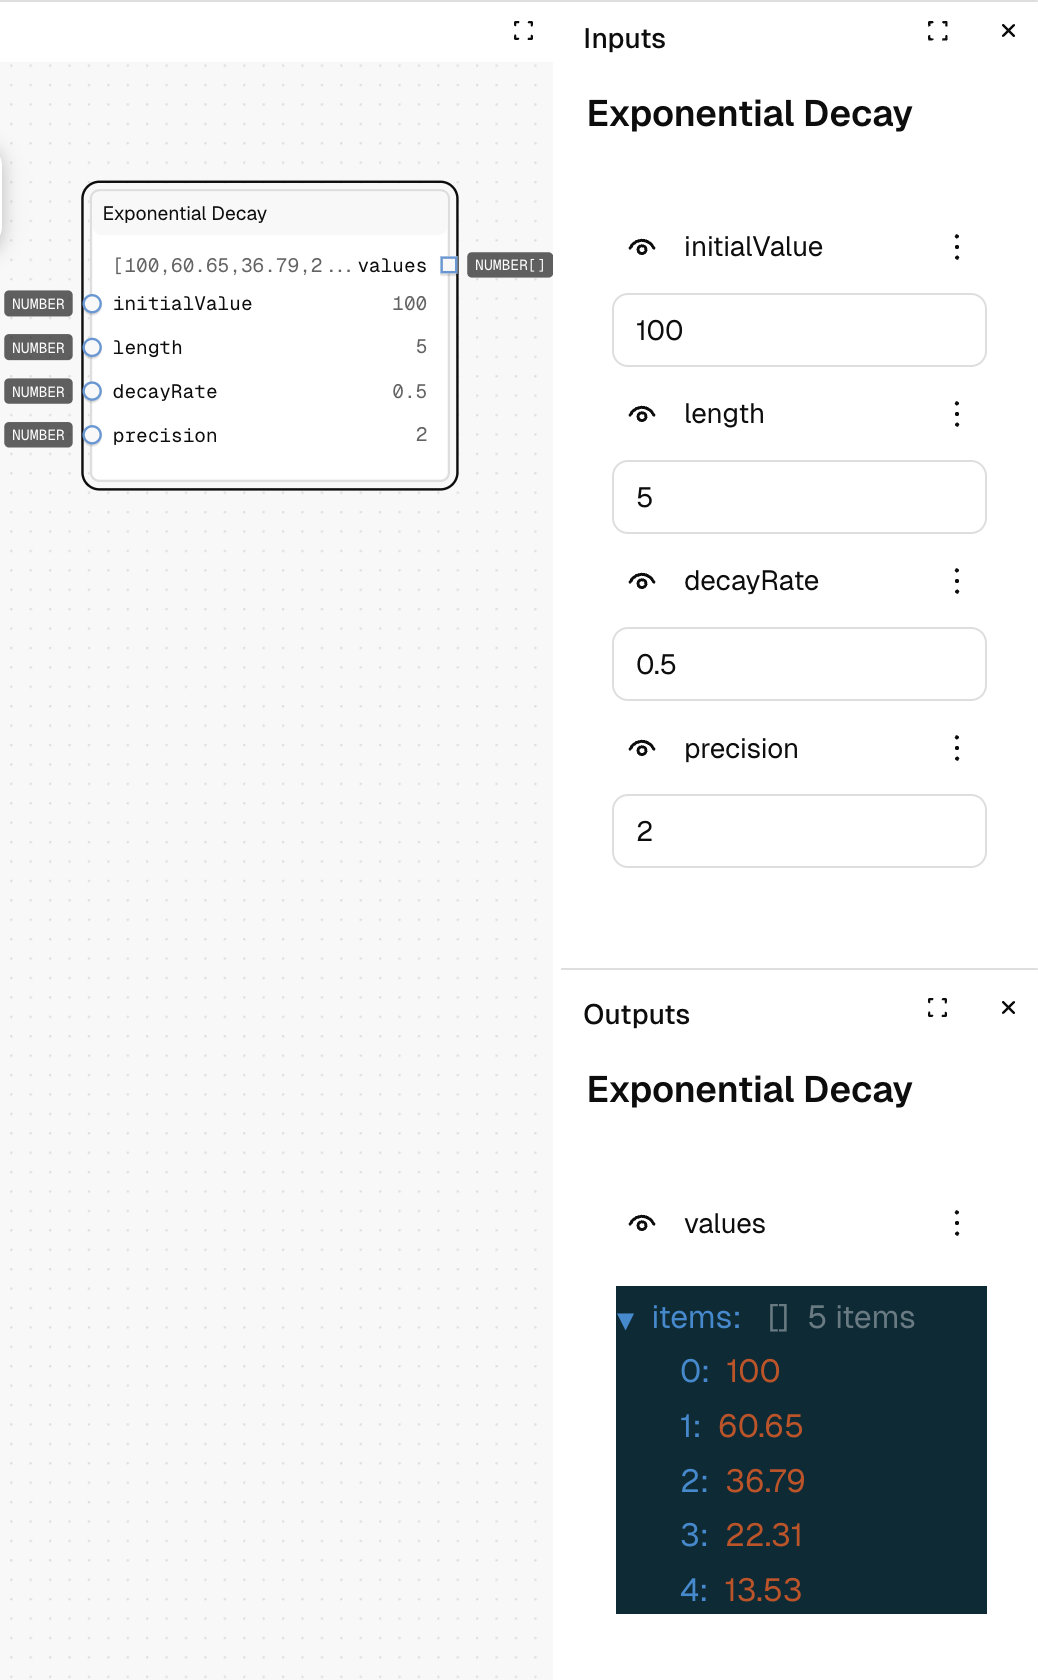
  2. Set the "initialValue" (default is 100).

  3. Set the "length" to specify how many values you want (default is 5).

  4. Set the "decayRate" to control how quickly values decrease (default is 0.5).

  5. Run the graph—with the default settings, your output will be [100, 60.65, 36.79, 22.31, 13.53].

Tips

  • Higher decay rates cause values to decrease more rapidly.

  • The decay is most dramatic at the beginning and gradually levels off.

  • The values will never reach zero, but will get increasingly close as the sequence continues.

See Also

  • Geometric Series: For a similar sequence where each term is a constant multiple of the previous.

  • Arithmetic Series: For sequences that decrease by a constant value.

  • Power Series: For sequences based on powers of a number.

Use Cases

  • Animation Easing: Create natural-looking deceleration effects.

  • Fade Out Effects: Generate opacity or volume values that gradually fade away.

  • Diminishing Returns: Model scenarios where additional inputs yield increasingly smaller outputs.

  • Physical Systems: Simulate natural decay processes like radioactive half-life or cooling.

Exponential Decay Example