Range
What It Does
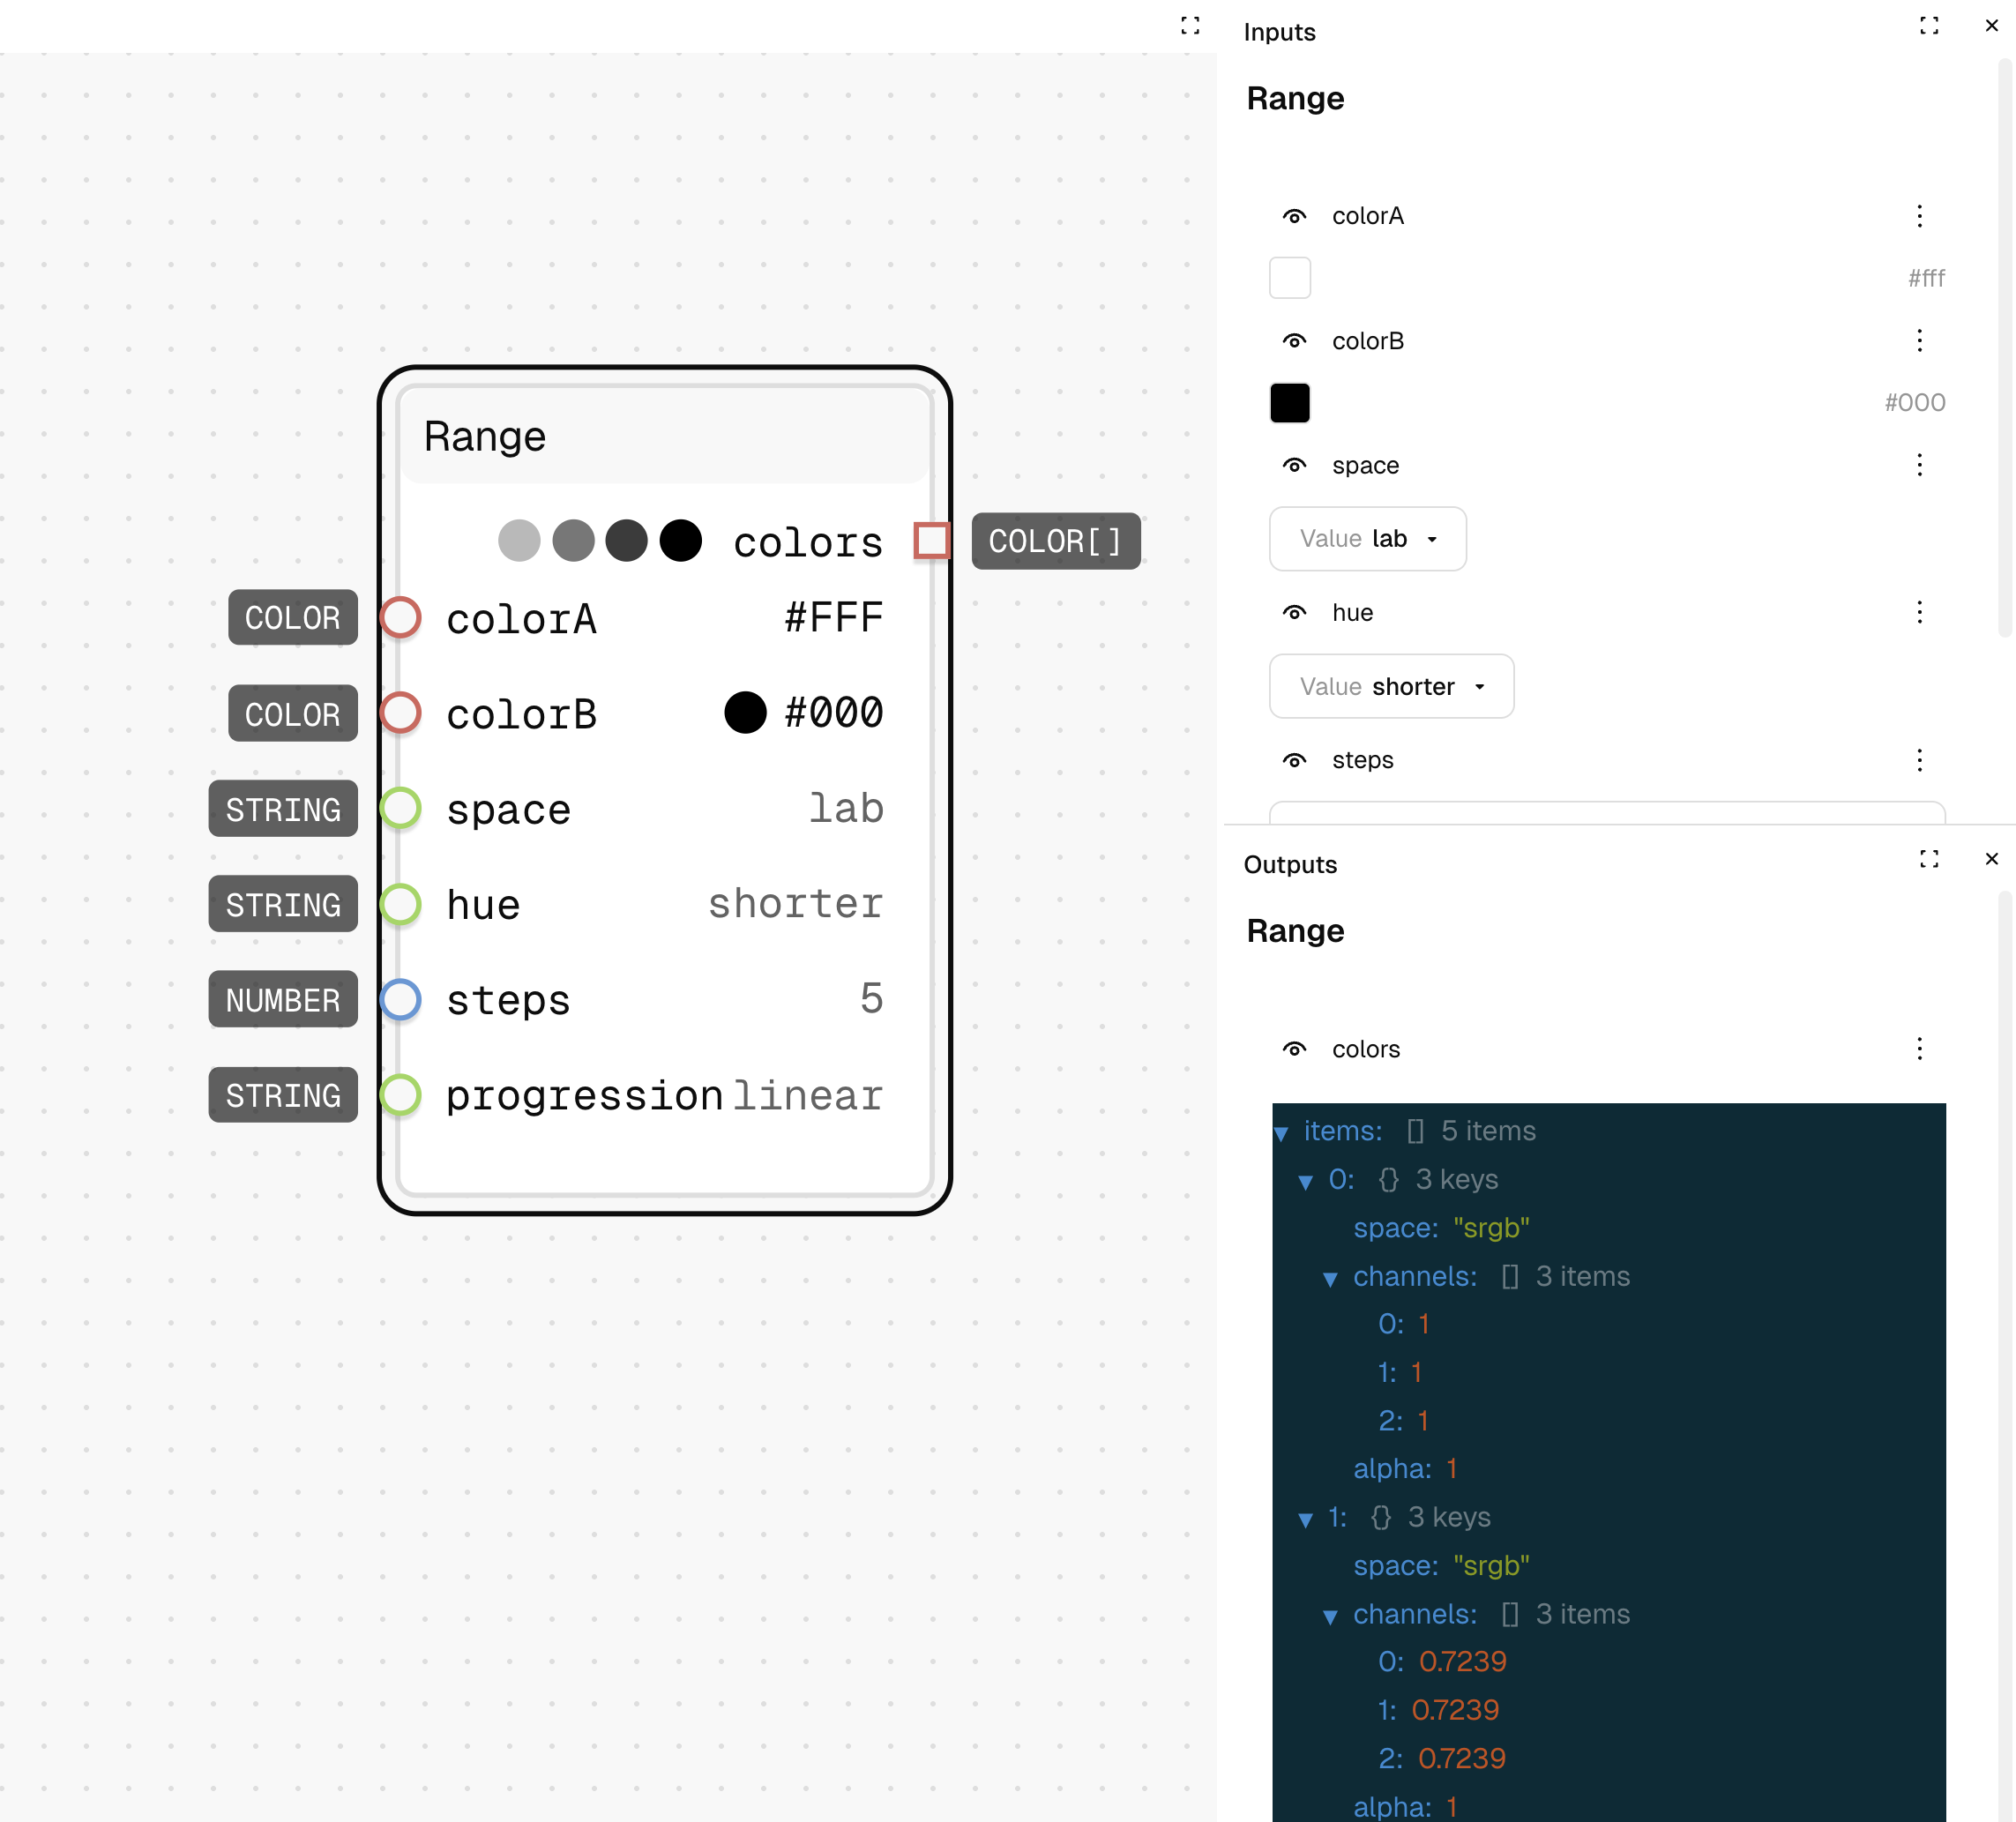
Creates a sequence of colors that transition smoothly between two endpoint colors. Perfect for generating color palettes, gradients, or stepping between design tokens with customizable interpolation.
Inputs
| Name | Description | Type | Required |
|---|---|---|---|
| colorA | The starting color | Color | No |
| colorB | The ending color | Color | No |
| space | The color space to interpolate in | String | No |
| hue | How to interpolate the hue (shorter, longer, etc.) | String | No |
| steps | Number of colors to generate (including endpoints) | Number | No |
| progression | The interpolation curve (linear, quadratic, cubic) | String | No |
Outputs
| Name | Description | Type |
|---|---|---|
| colors | Array of colors transitioning from colorA to colorB | List |
How to Use It
- Drag the Range node into your graph.
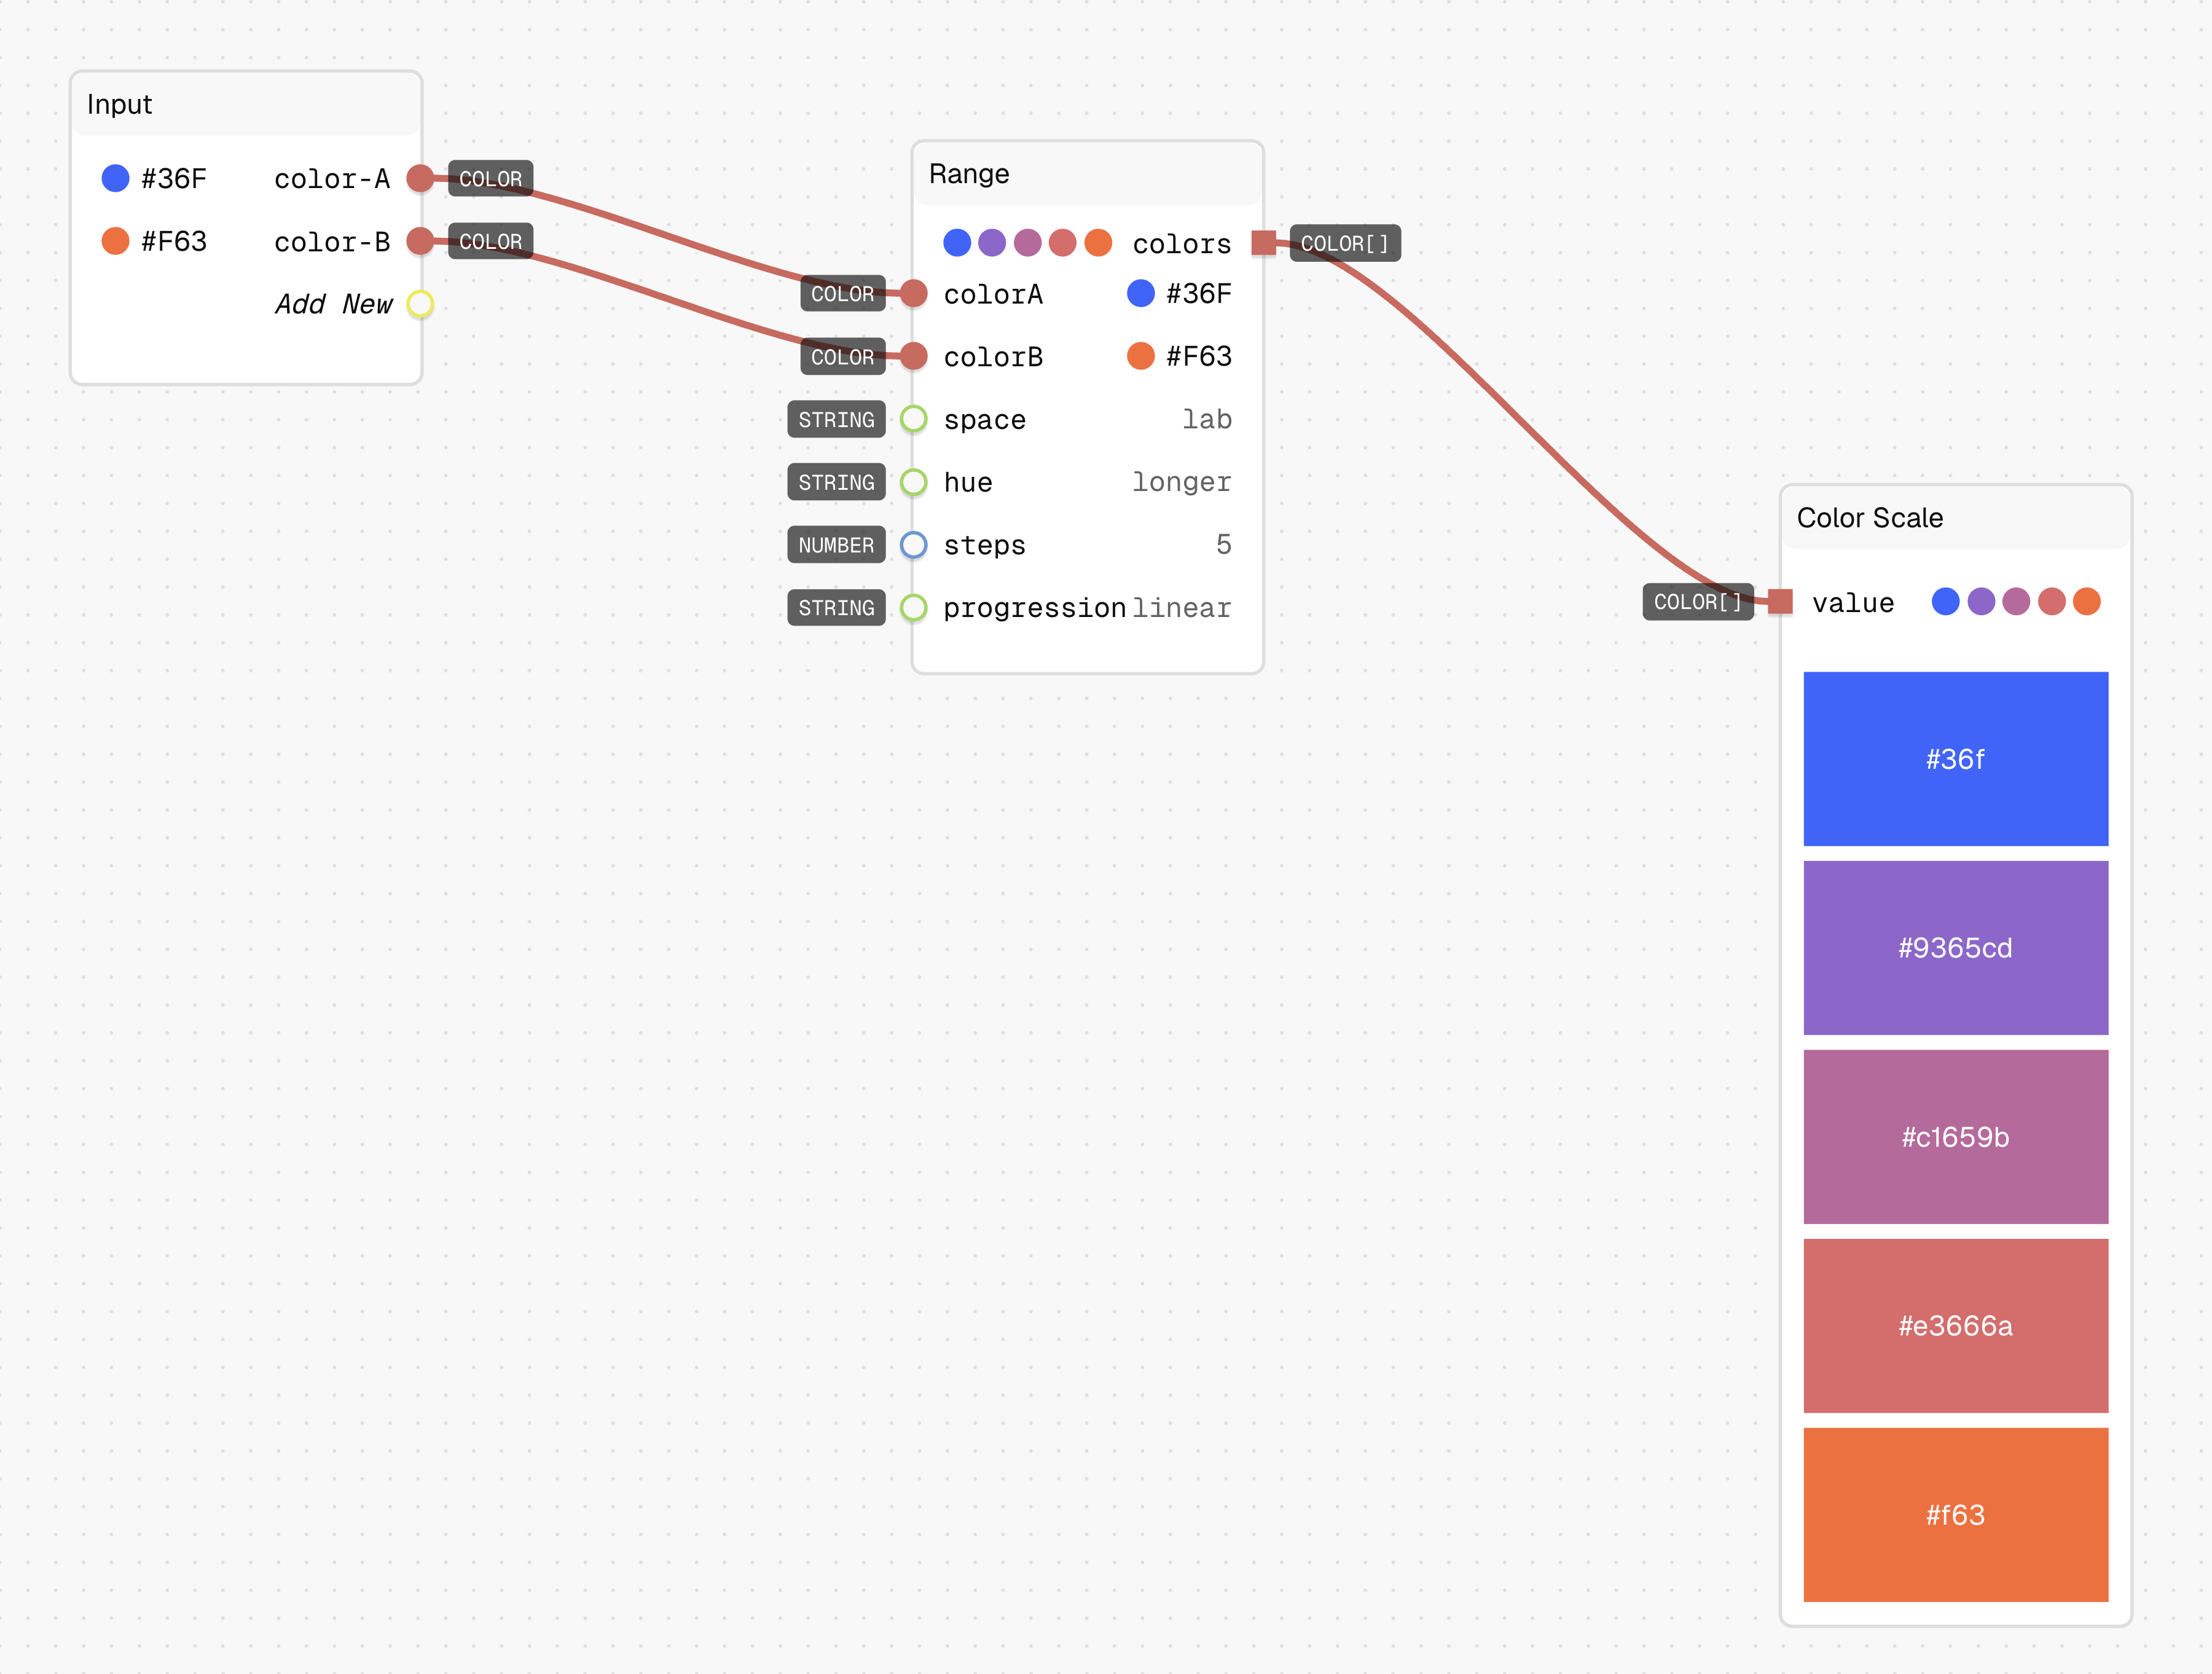
- Connect your starting color (like
#3366FF) to the "colorA" input. - Connect your ending color (like
#FF6633) to the "colorB" input. - Set the color "space" to interpolate in (like lab).
- Set "steps" to the number of colors you want (e.g., 5).
- Set the progression to define the interpolation (like linear).
- Run the graph—your output will be an array of colors that form a smooth transition.
Tips
- Different color spaces produce different transitions. "Lab" and "Oklch" usually give the most perceptually uniform results.
- The "progression" parameter controls the easing of the transition—try different options for varied effects.
See Also
- Mix Colors: For blending just two colors together.
- Scale Colors: For creating variants of a single color.
Use Cases
- Color Palettes: Generate a consistent palette with evenly spaced colors for data visualization.
- Gradient Creation: Build multi-stop gradient definitions for backgrounds or UI elements.
- Token Scales: Create a complete set of design tokens from light to dark for a design system.