Bezier Curve
What It Does
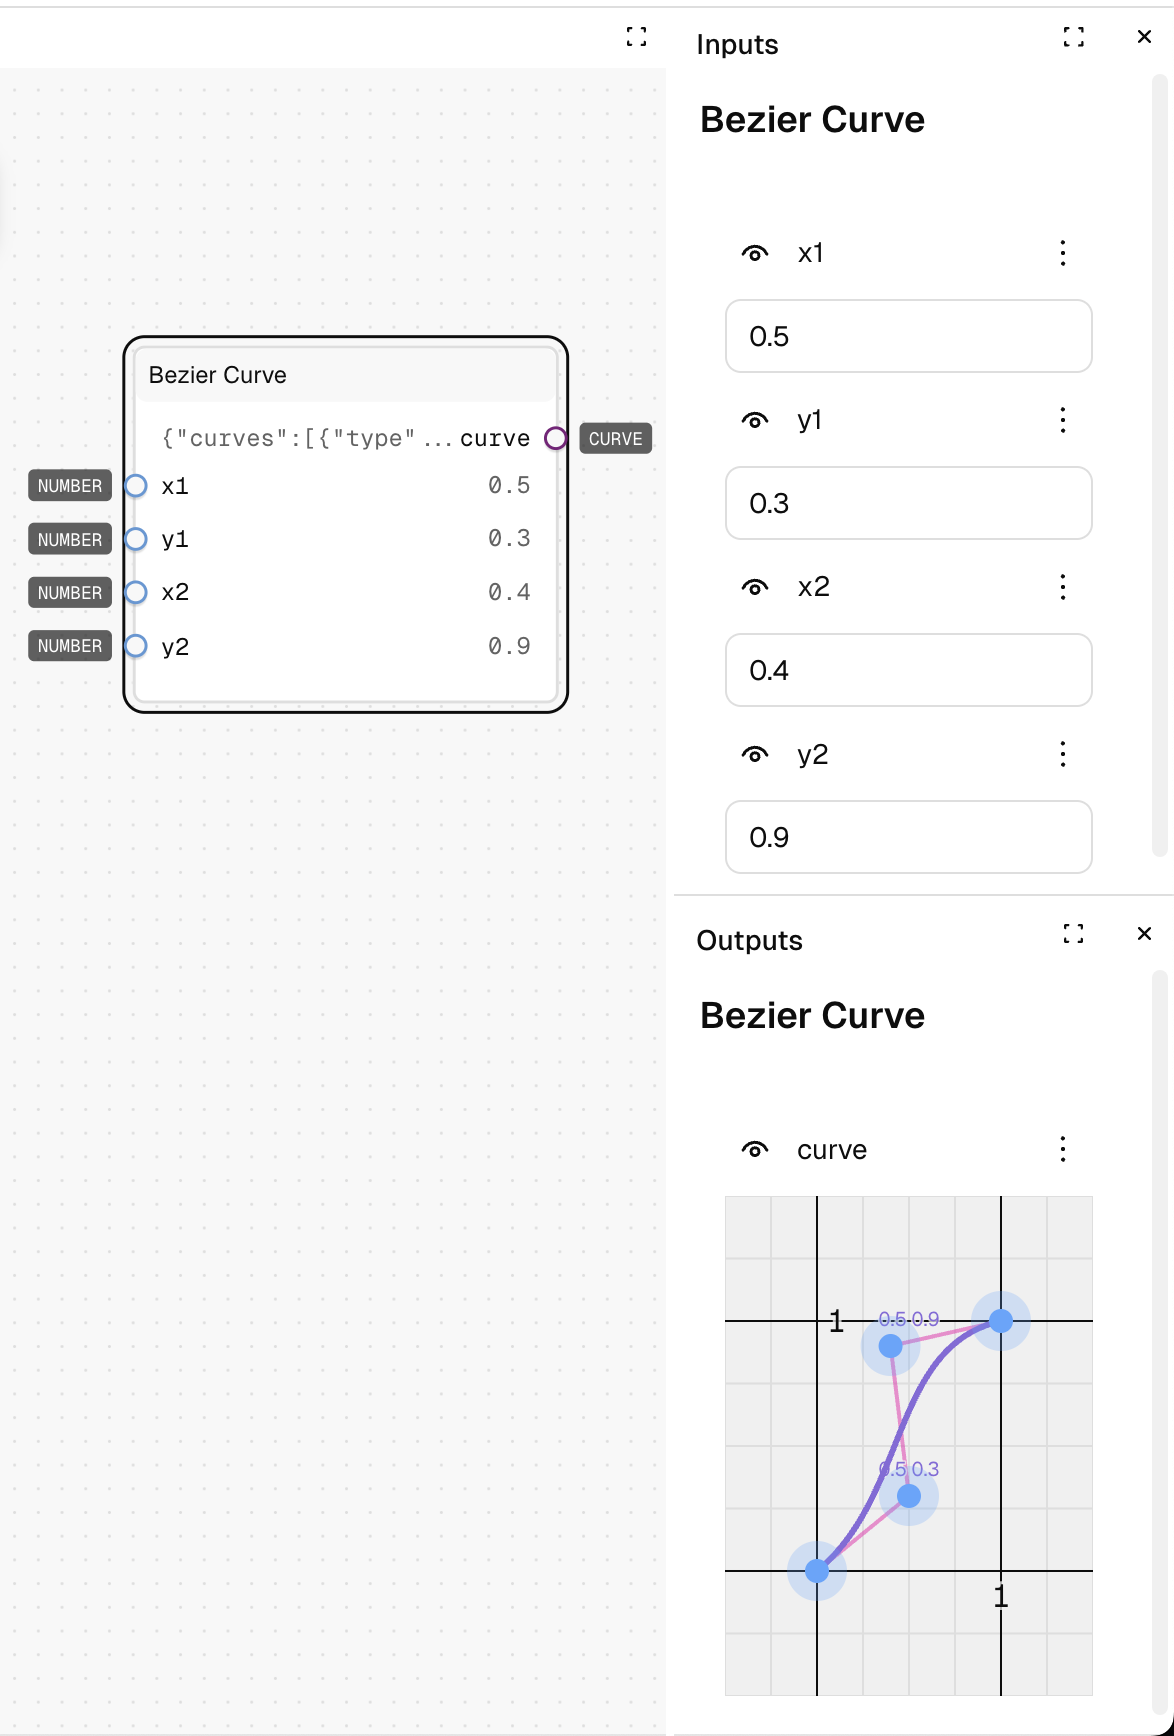
Creates a cubic Bezier curve by defining two control points that determine the curve's shape. The curve always starts at point (0,0) and ends at point (1,1), with the control points determining how it curves between these fixed points.
Inputs
| Name | Description | Type | Required |
|---|---|---|---|
| x1 | X coordinate of the first control point (0-1) | Number | No |
| y1 | Y coordinate of the first control point (0-1) | Number | No |
| x2 | X coordinate of the second control point (0-1) | Number | No |
| y2 | Y coordinate of the second control point (0-1) | Number | No |
Outputs
| Name | Description | Type |
|---|---|---|
| curve | The resulting Bezier curve | Curve |
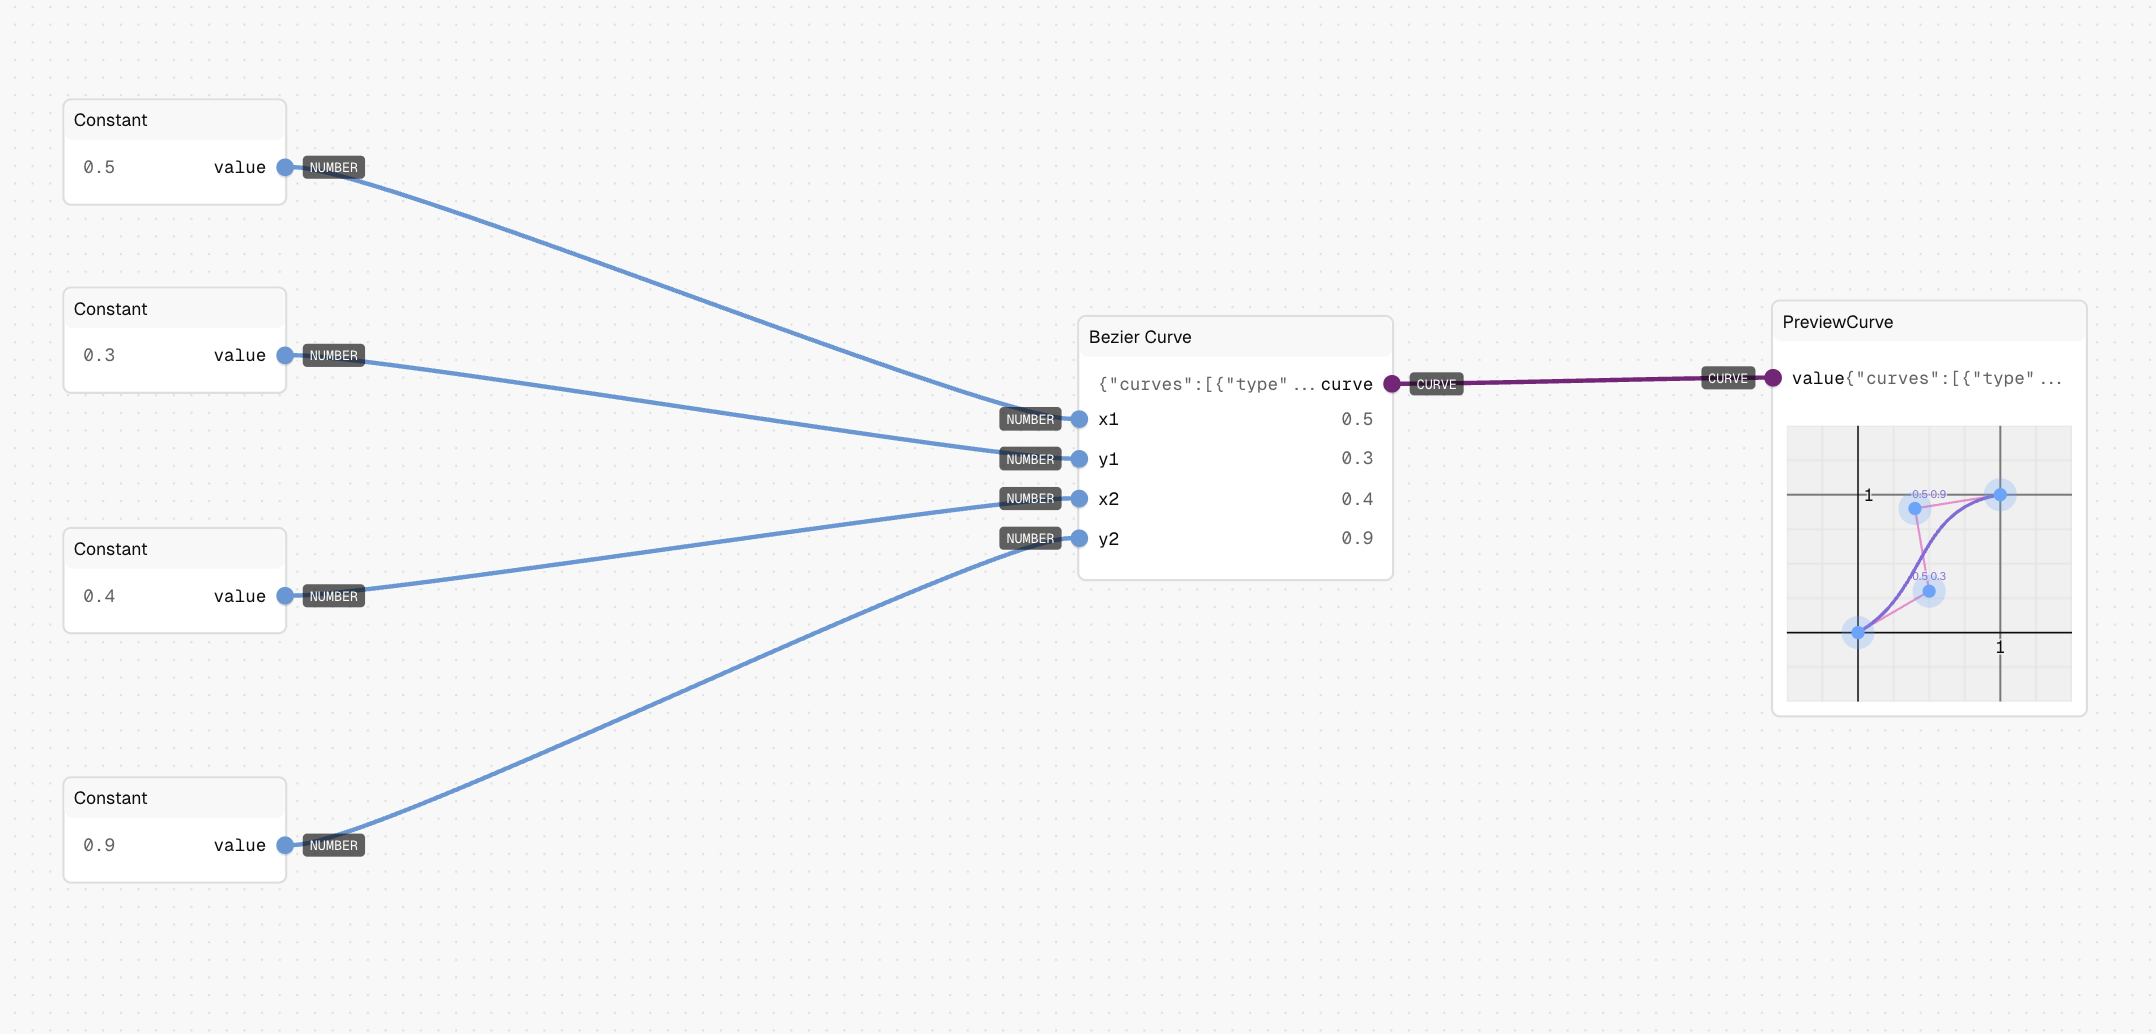
How to Use It
- Drag the Bezier Curve node into your graph.
- Set the x1, y1 coordinates for the first control point (default is 0.5, 0).
- Set the x2, y2 coordinates for the second control point (default is 0.5, 1).
- Run the graph—the output will be a Bezier curve object you can use with other curve nodes.
- Adjust the control points to change the shape of the curve.
Tips
- Different control point configurations create different curve behaviors:
- Linear: Set points to (0,0) and (1,1)
- Ease-in: Set points to (0.42, 0) and (1, 1)
- Ease-out: Set points to (0, 0) and (0.58, 1)
- Ease-in-out: Set points to (0.42, 0) and (0.58, 1)
- All coordinates must be between 0 and 1.
See Also
- Preset Beziers: For commonly used predefined Bezier curves.
- Sample Curve: To evaluate a curve at a specific point.
- Float Curve: For more complex curve definitions.
Use Cases
- Animation Timing: Create custom easing functions for smoother animations.
- Interpolation Control: Define how values should blend between endpoints.