Creating a simple color scale
What It Does
Creates a systematic color palette using algorithmic color scaling. This multi-step workflow generates a complete, systematic color scale using a algorithm. Starting with a base color, design tokens are created, organized, and named through it’s hierarchy.
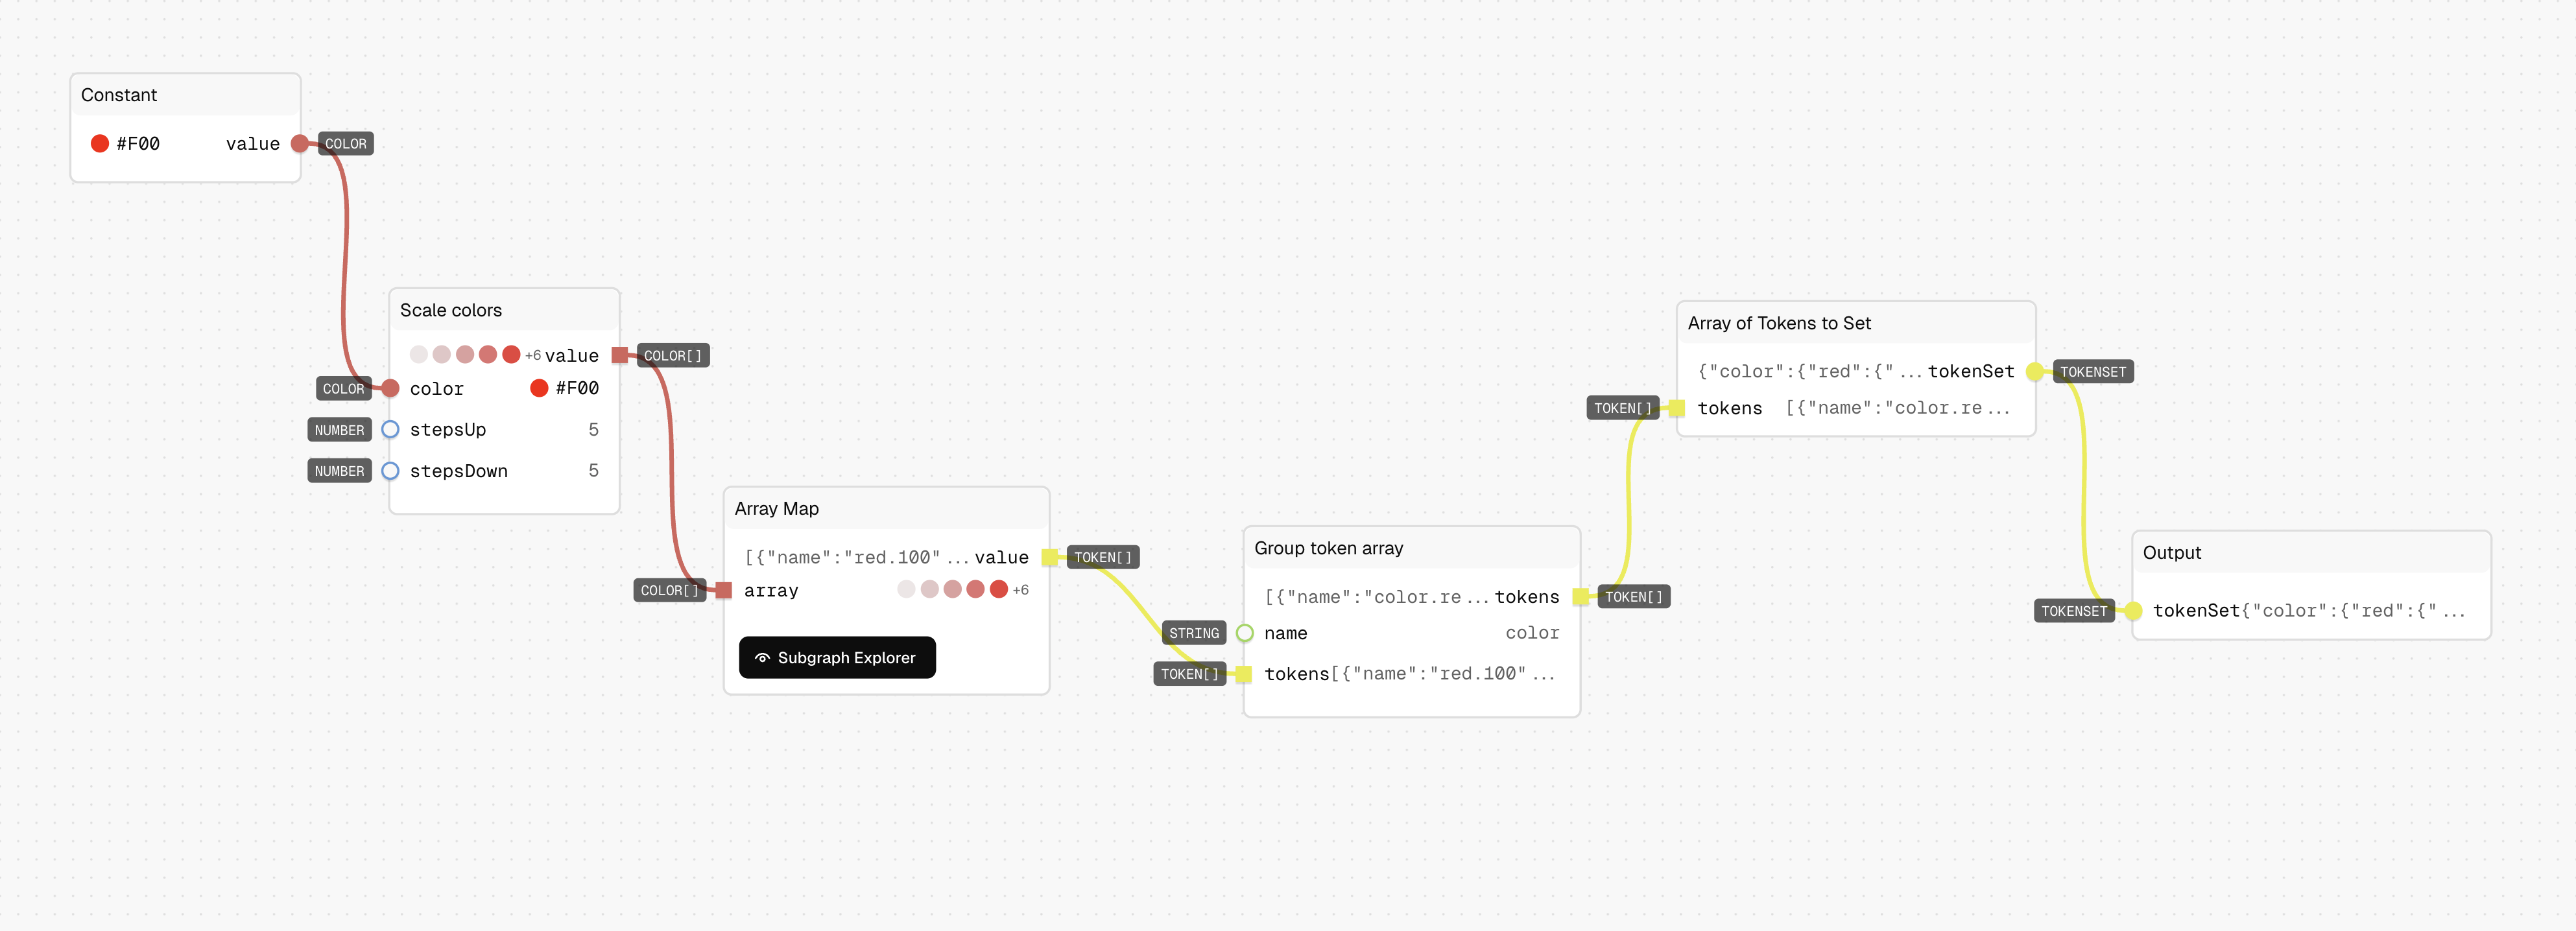
Complete Workflow
This example demonstrates a 6-step process that transforms a single base color into a complete token system:
- Base Color Setup: Define the starting color
- Color Scale Generation: Create algorithmically related shades
- Token Creation: Convert each color into a named token
- Namespace Grouping: Add hierarchical prefixes
- Set Conversion: Format for token system output
- Final Export: Output structured token set
Step 1: Selecting a base color for creating a scale
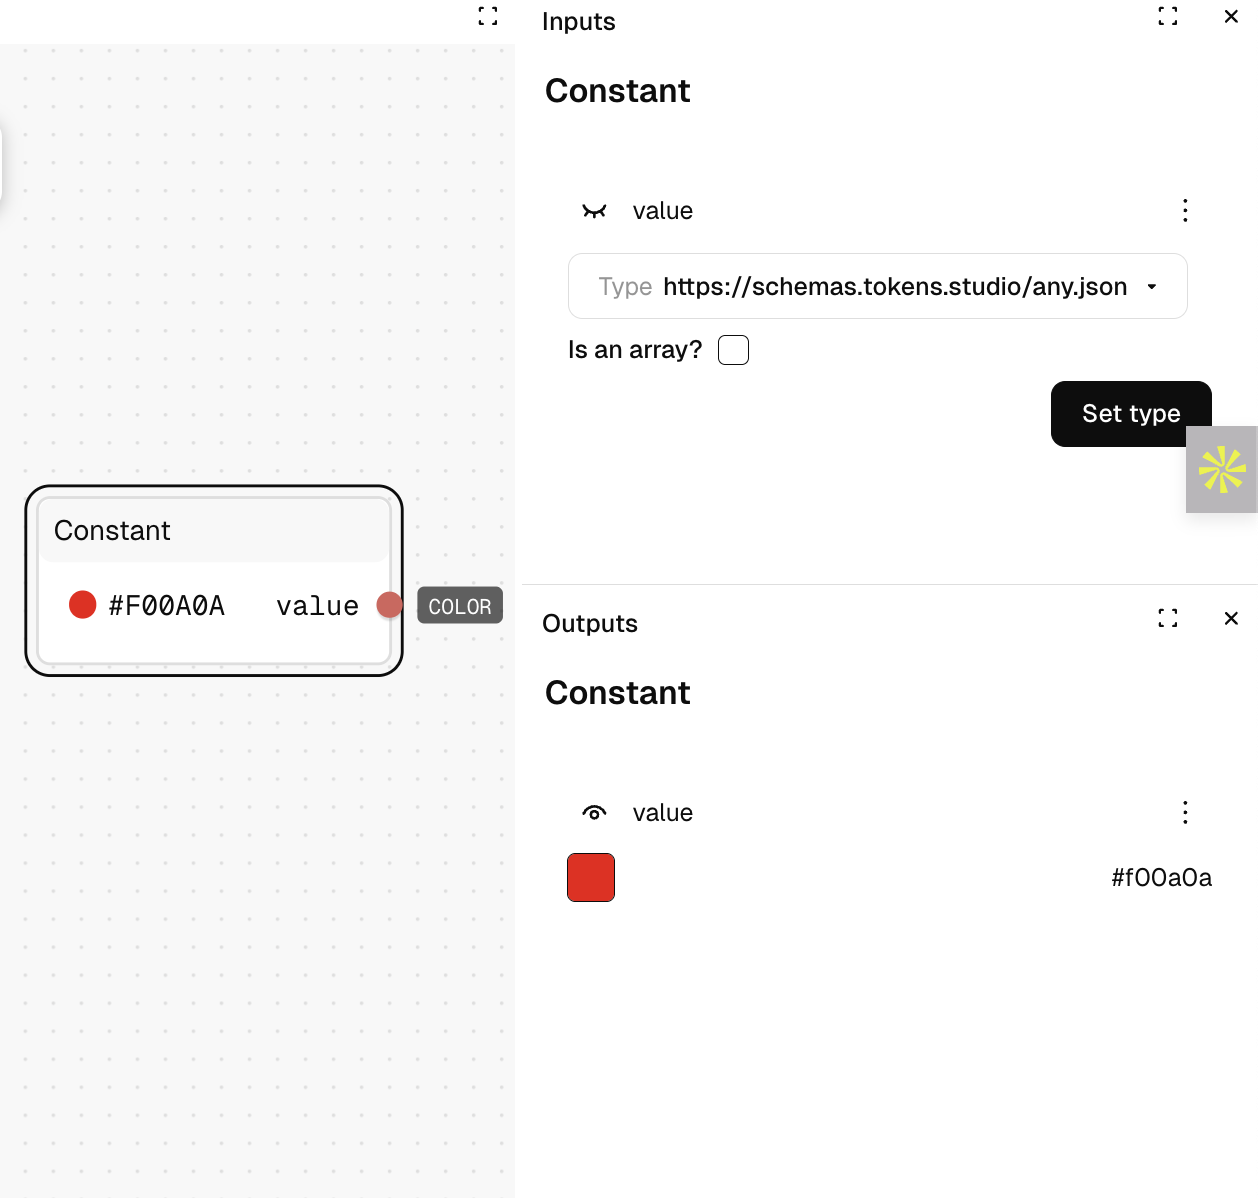
Selecting a color which will be used as the base color of a generated scale can be done in a number of ways using different nodes like Constant, Create Color, Input etc. In this example, we will use Constant node as our starting point.
- Drag a Constant node (Generic > Constant) into your graph.
- Set the type of the input to be "Color" from the dropdown.
- Set your base color value (the color that all other shades will be generated from).
- The node will output the color value ready for scale generation.
Why Color Type Matters: Setting the input type to "Color" ensures the Scale Colors node (which we will use to generate the color scale) can perform proper color calculations and transformations.
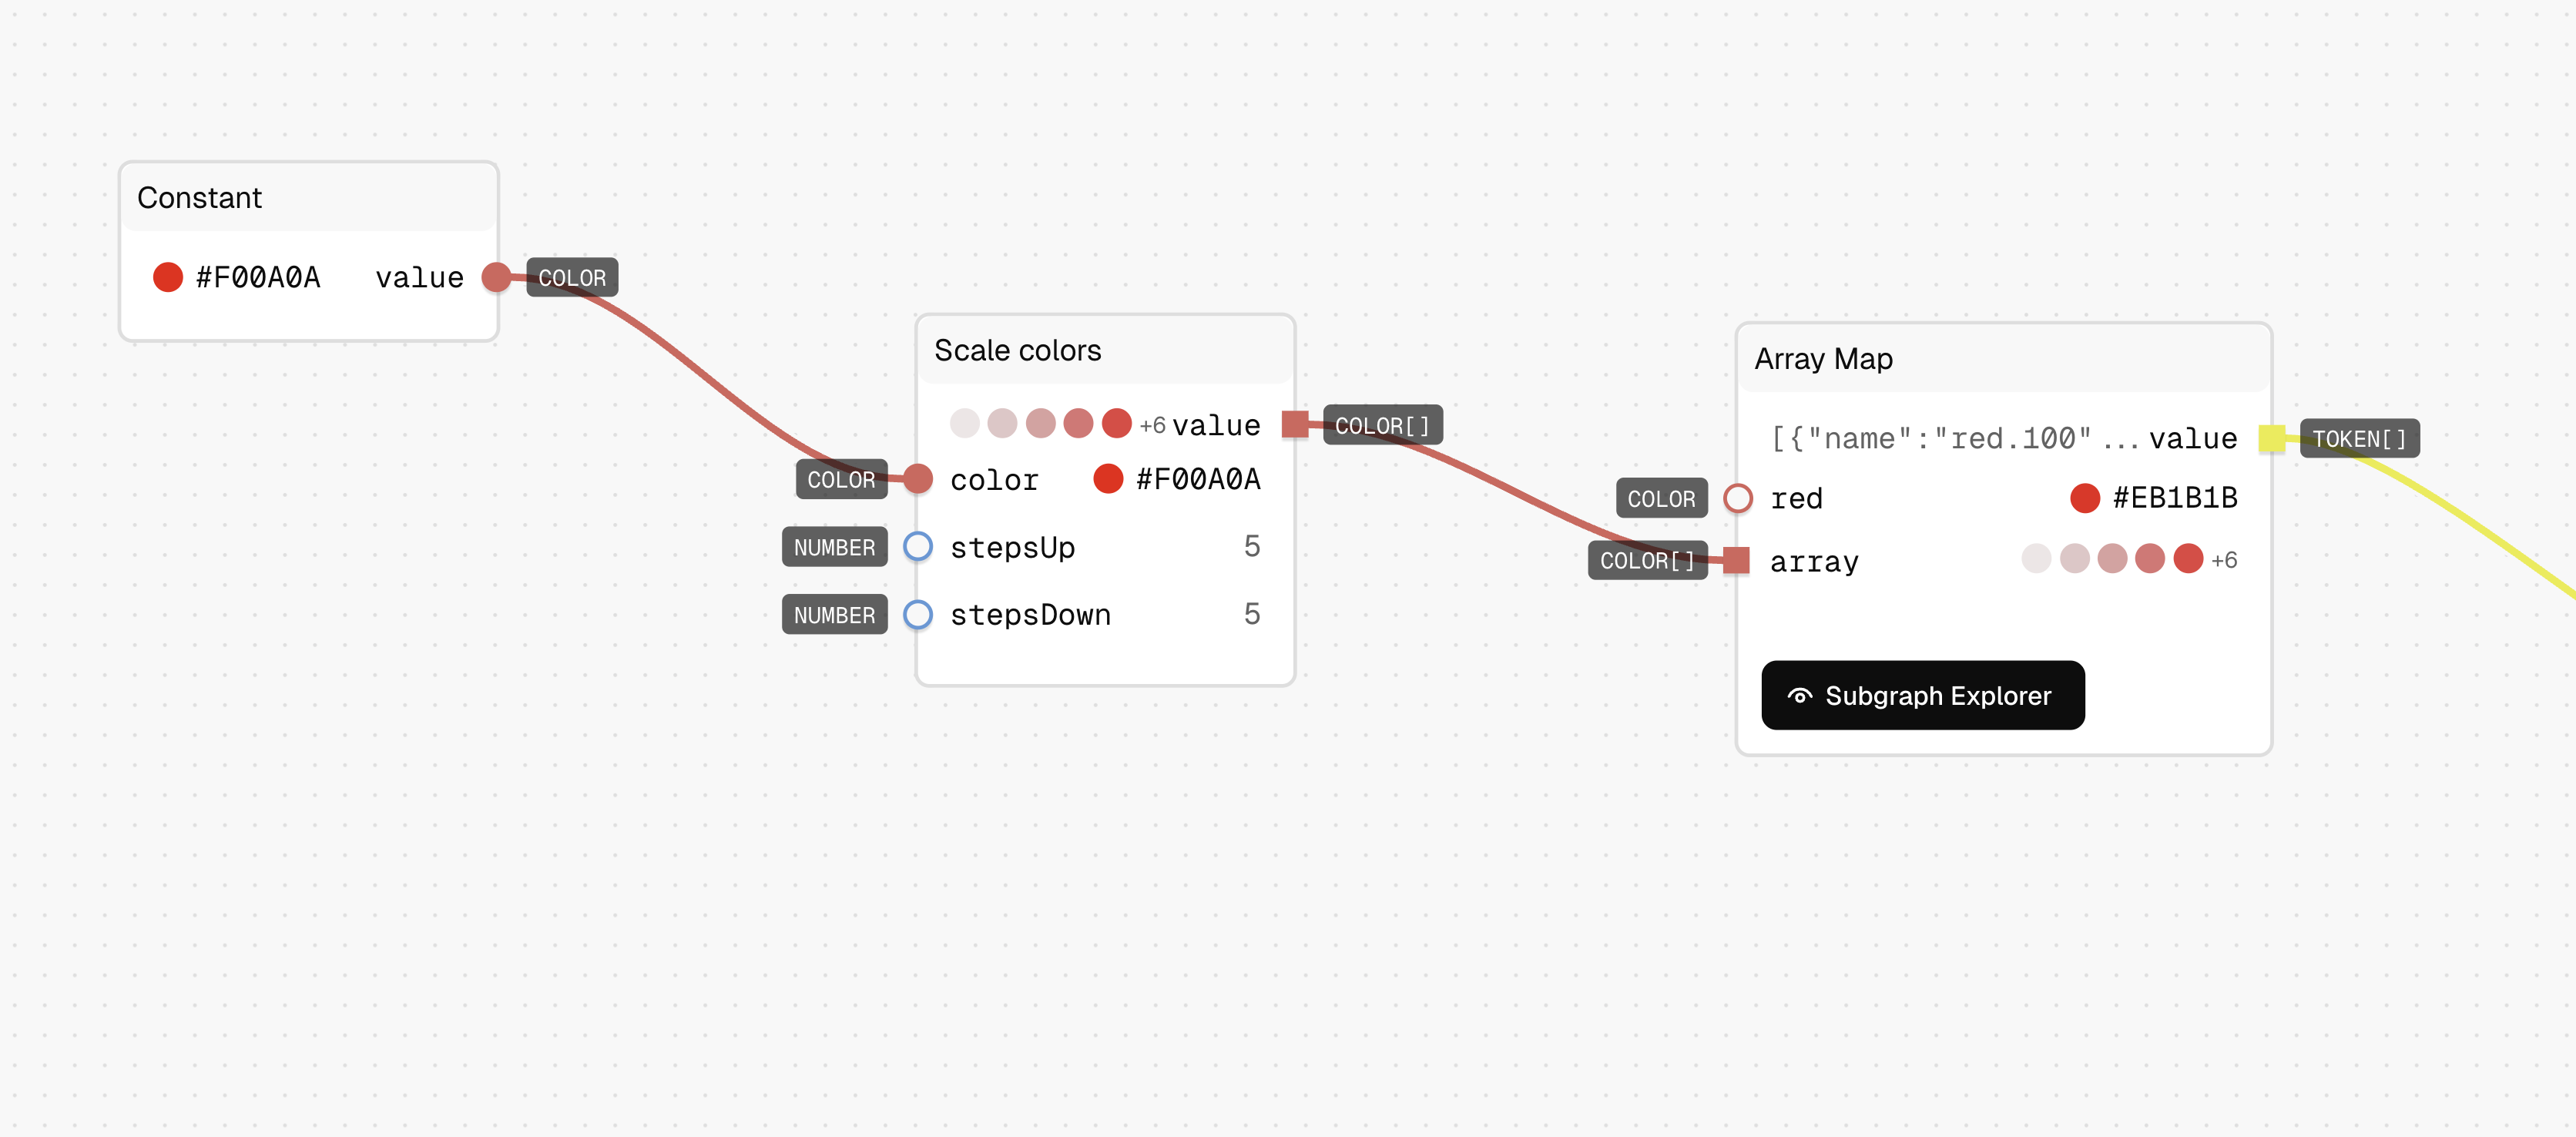
Step 2: Generating a color scale using the base color
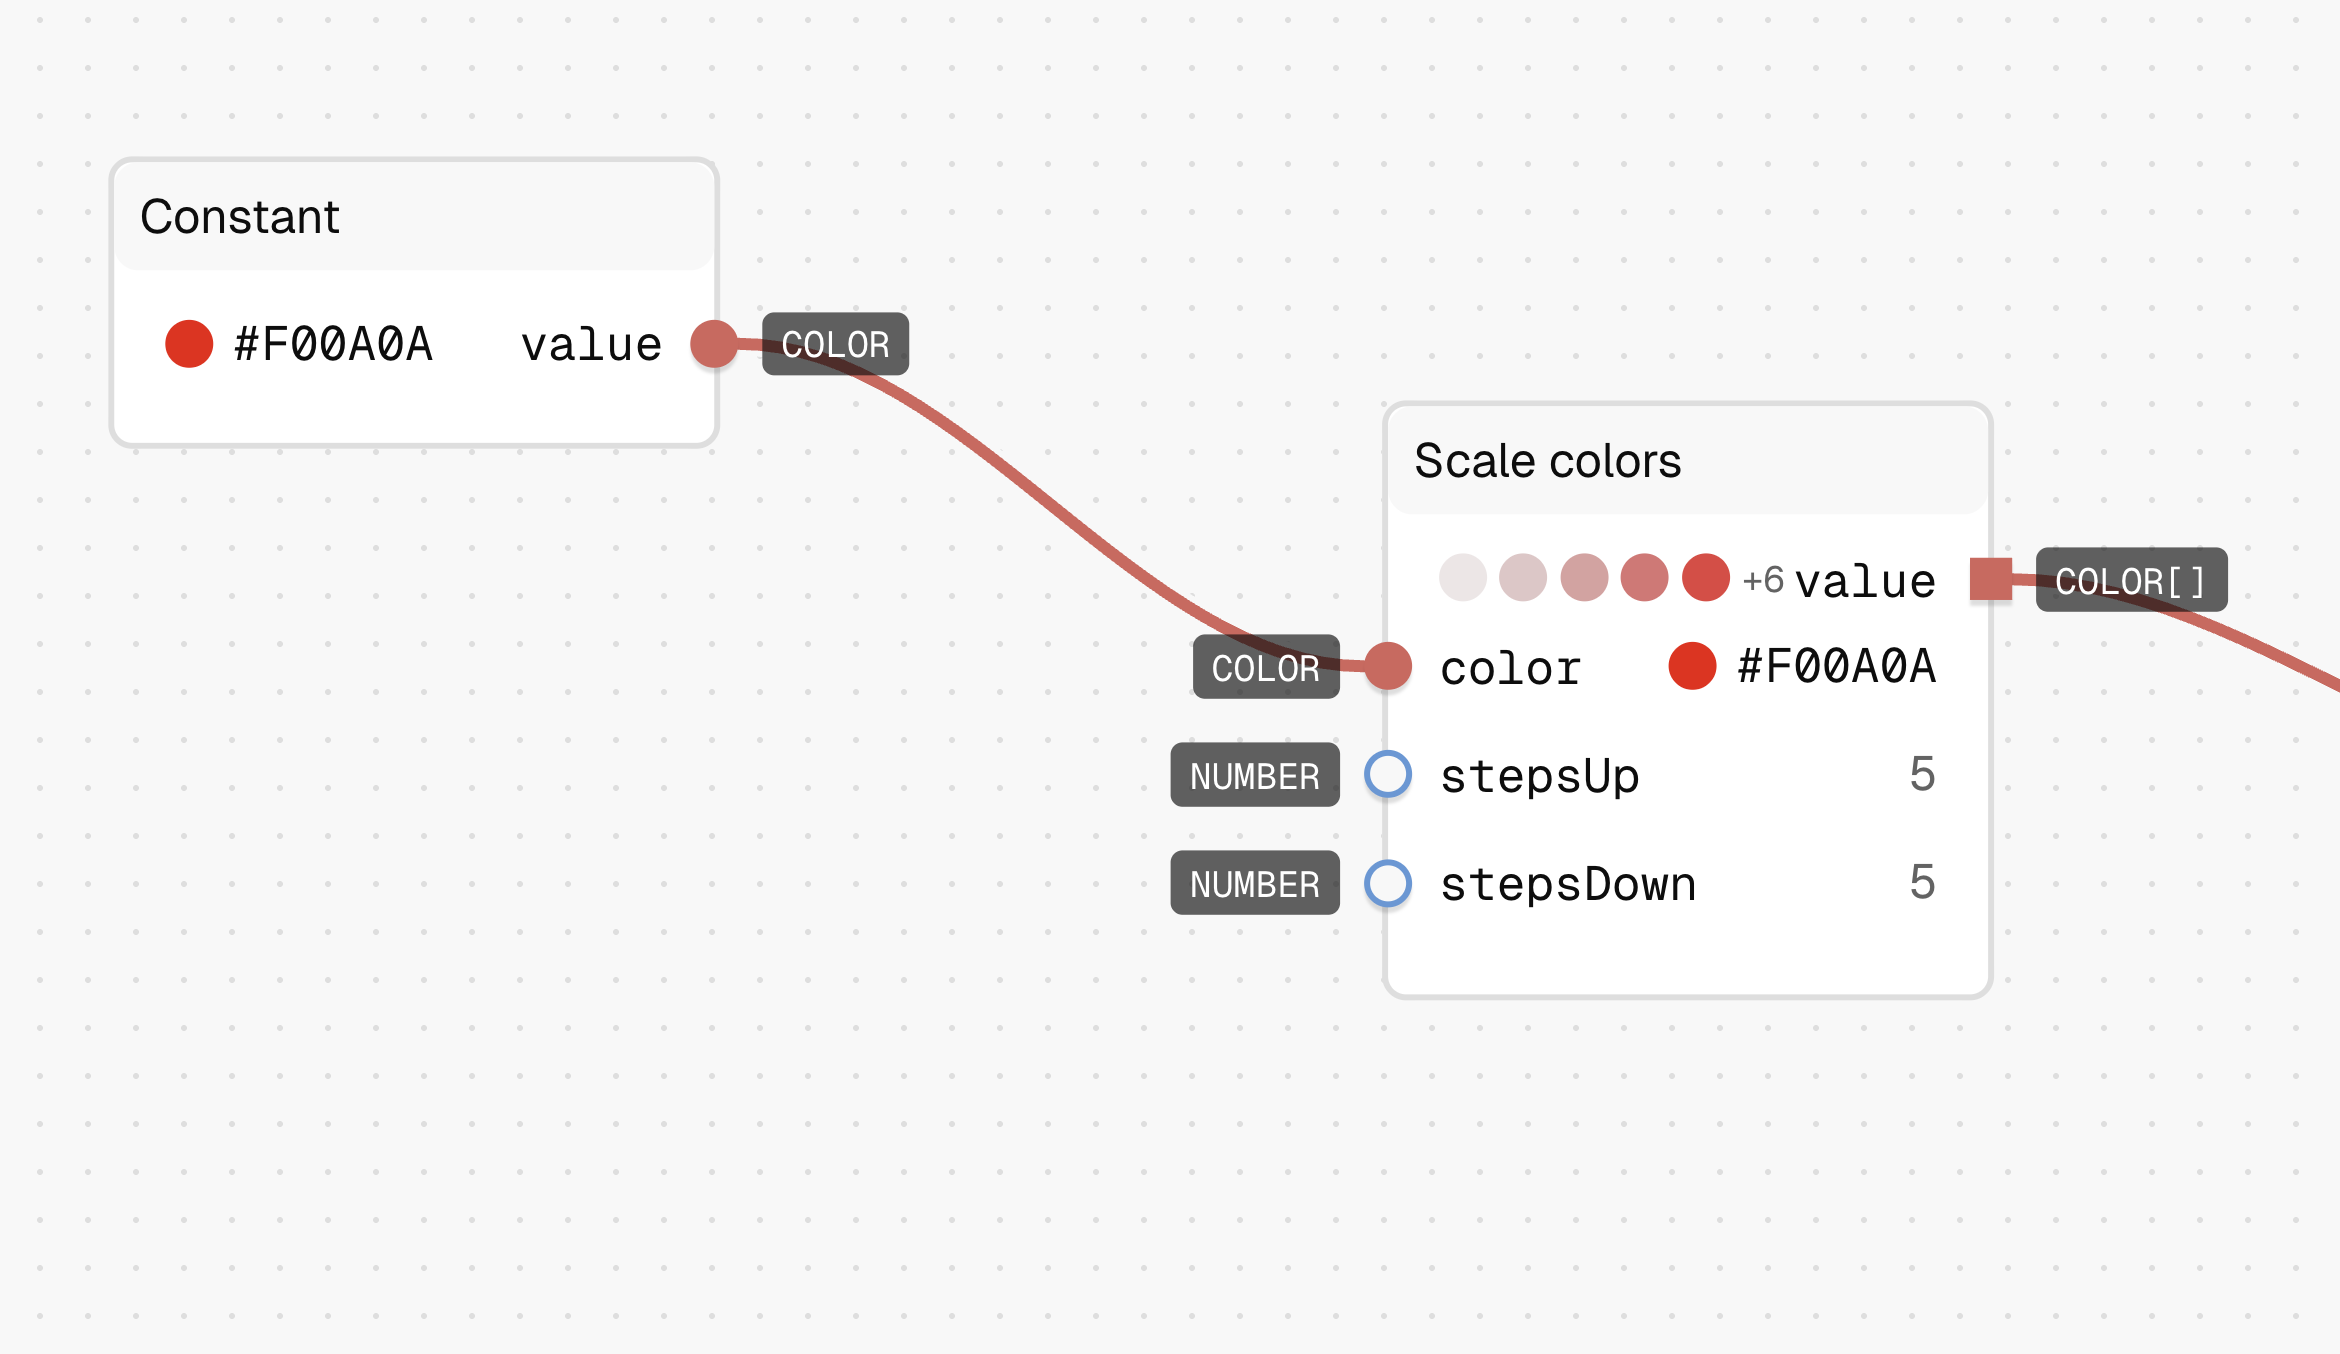
Once we have the base color as the output from our Constant node we want to generate a scale using the selected base color. To generate a color scale we will use a Scale Colors node. This node takes a base color and generates a color scale, the number of steps in the scale can be adjusted by adjusting the stepsUp and stepsDown input in the node.
- Drag a Scale Colors node into your graph.
- Connect the output from your Constant node to the input named color in the Scale colors node.
- You can adjust the number of steps in the scale, in this example we are creating a scale with 11 steps. This is done by setting the
stepsUpto "5" andstepsDownto "5", so we have a scale with 5 colors above and below the base color. - The output will be a list (array) of 11 colors from lightest to darkest using your base color.
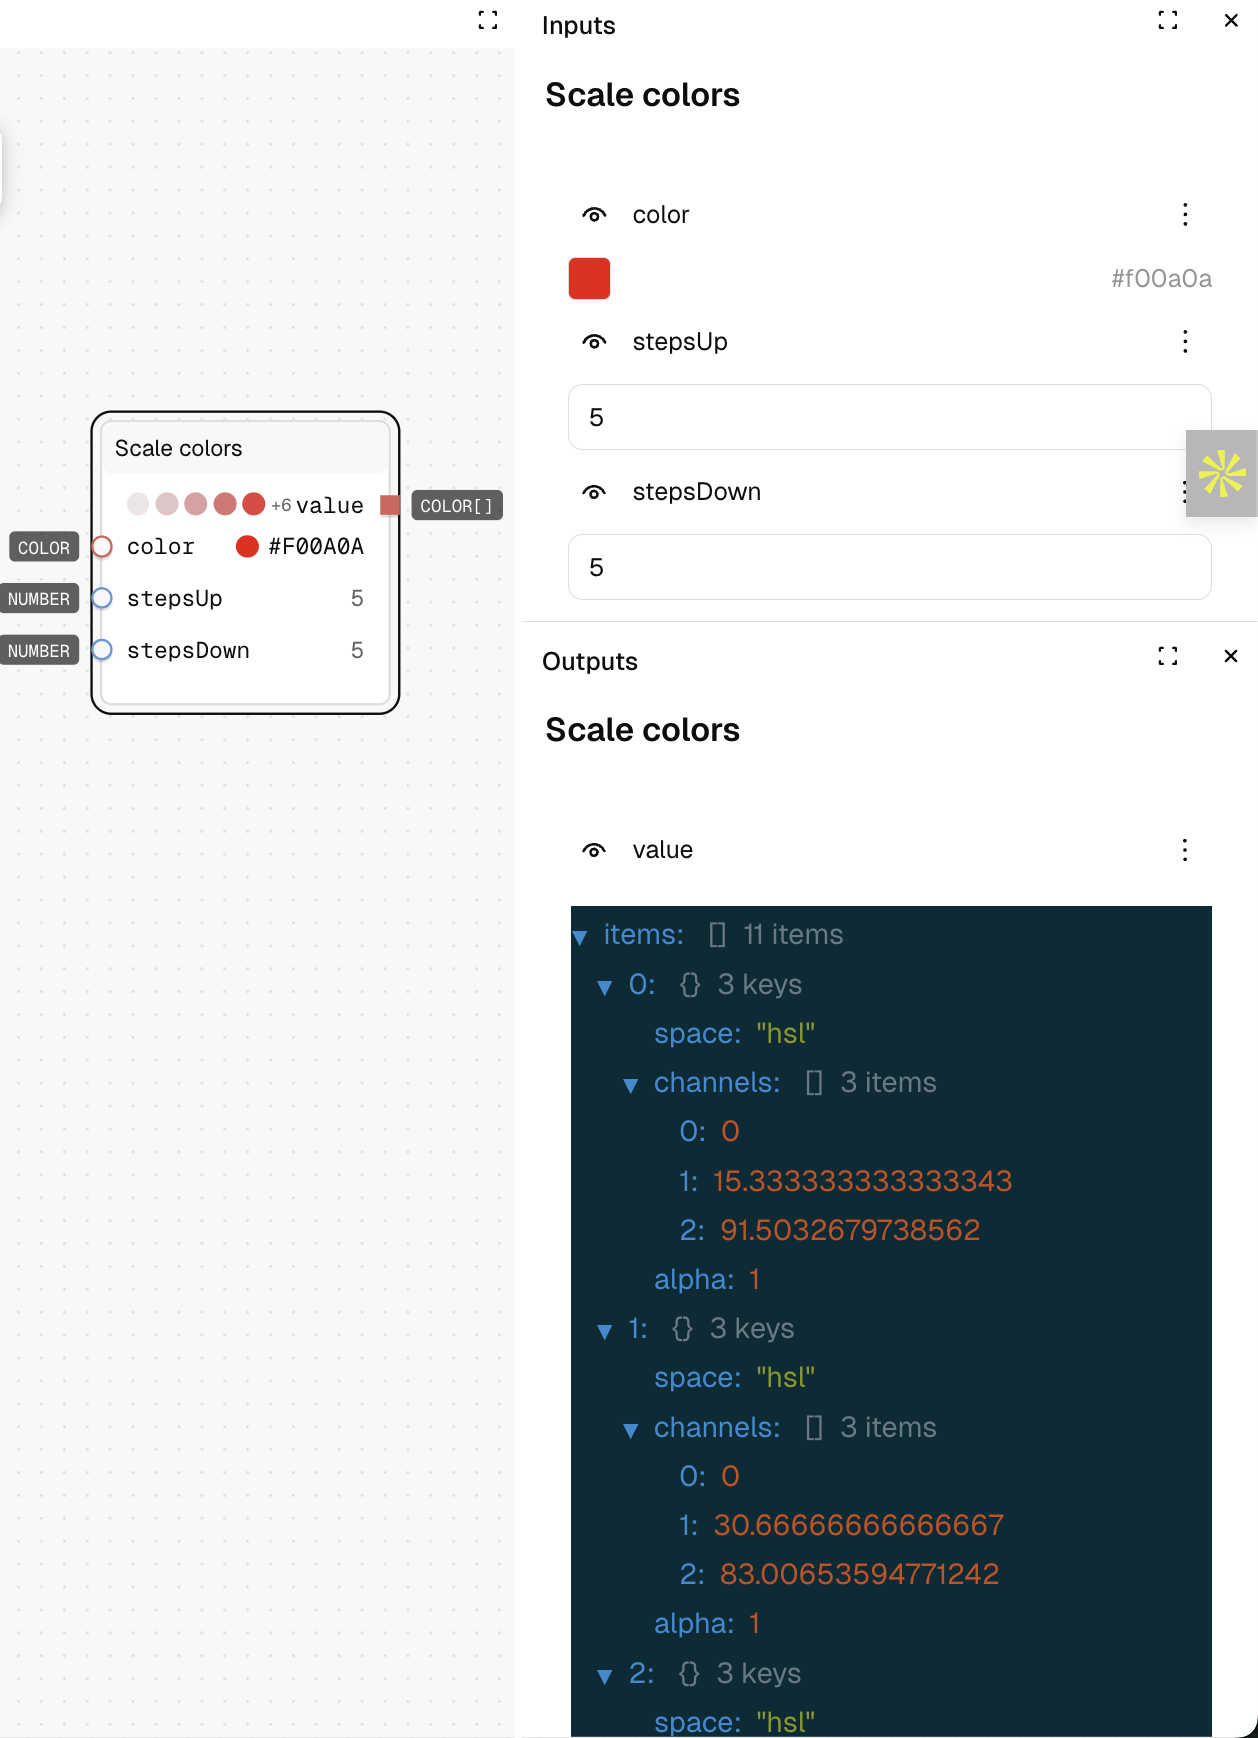
We now have a list of colors but these colors are not yet in the design token format. In this example we want to convert these colors into design tokens and also name our design tokens in a logical manner.
Step 3: Token Creation (Array Map Subgraph)
To create design tokens from our color scale, we use the Array Map node. The Array Map node allows you to perform an action on each item in a list. An Array Map node has an internal graph called a subgraph that operates on each item.
- Drag an Array Map node into your graph.
- Connect the output of your Scale colors node to the input of the Array Map node.
- To define what happens inside the Array Map, click on the Subgraph Explorer button.
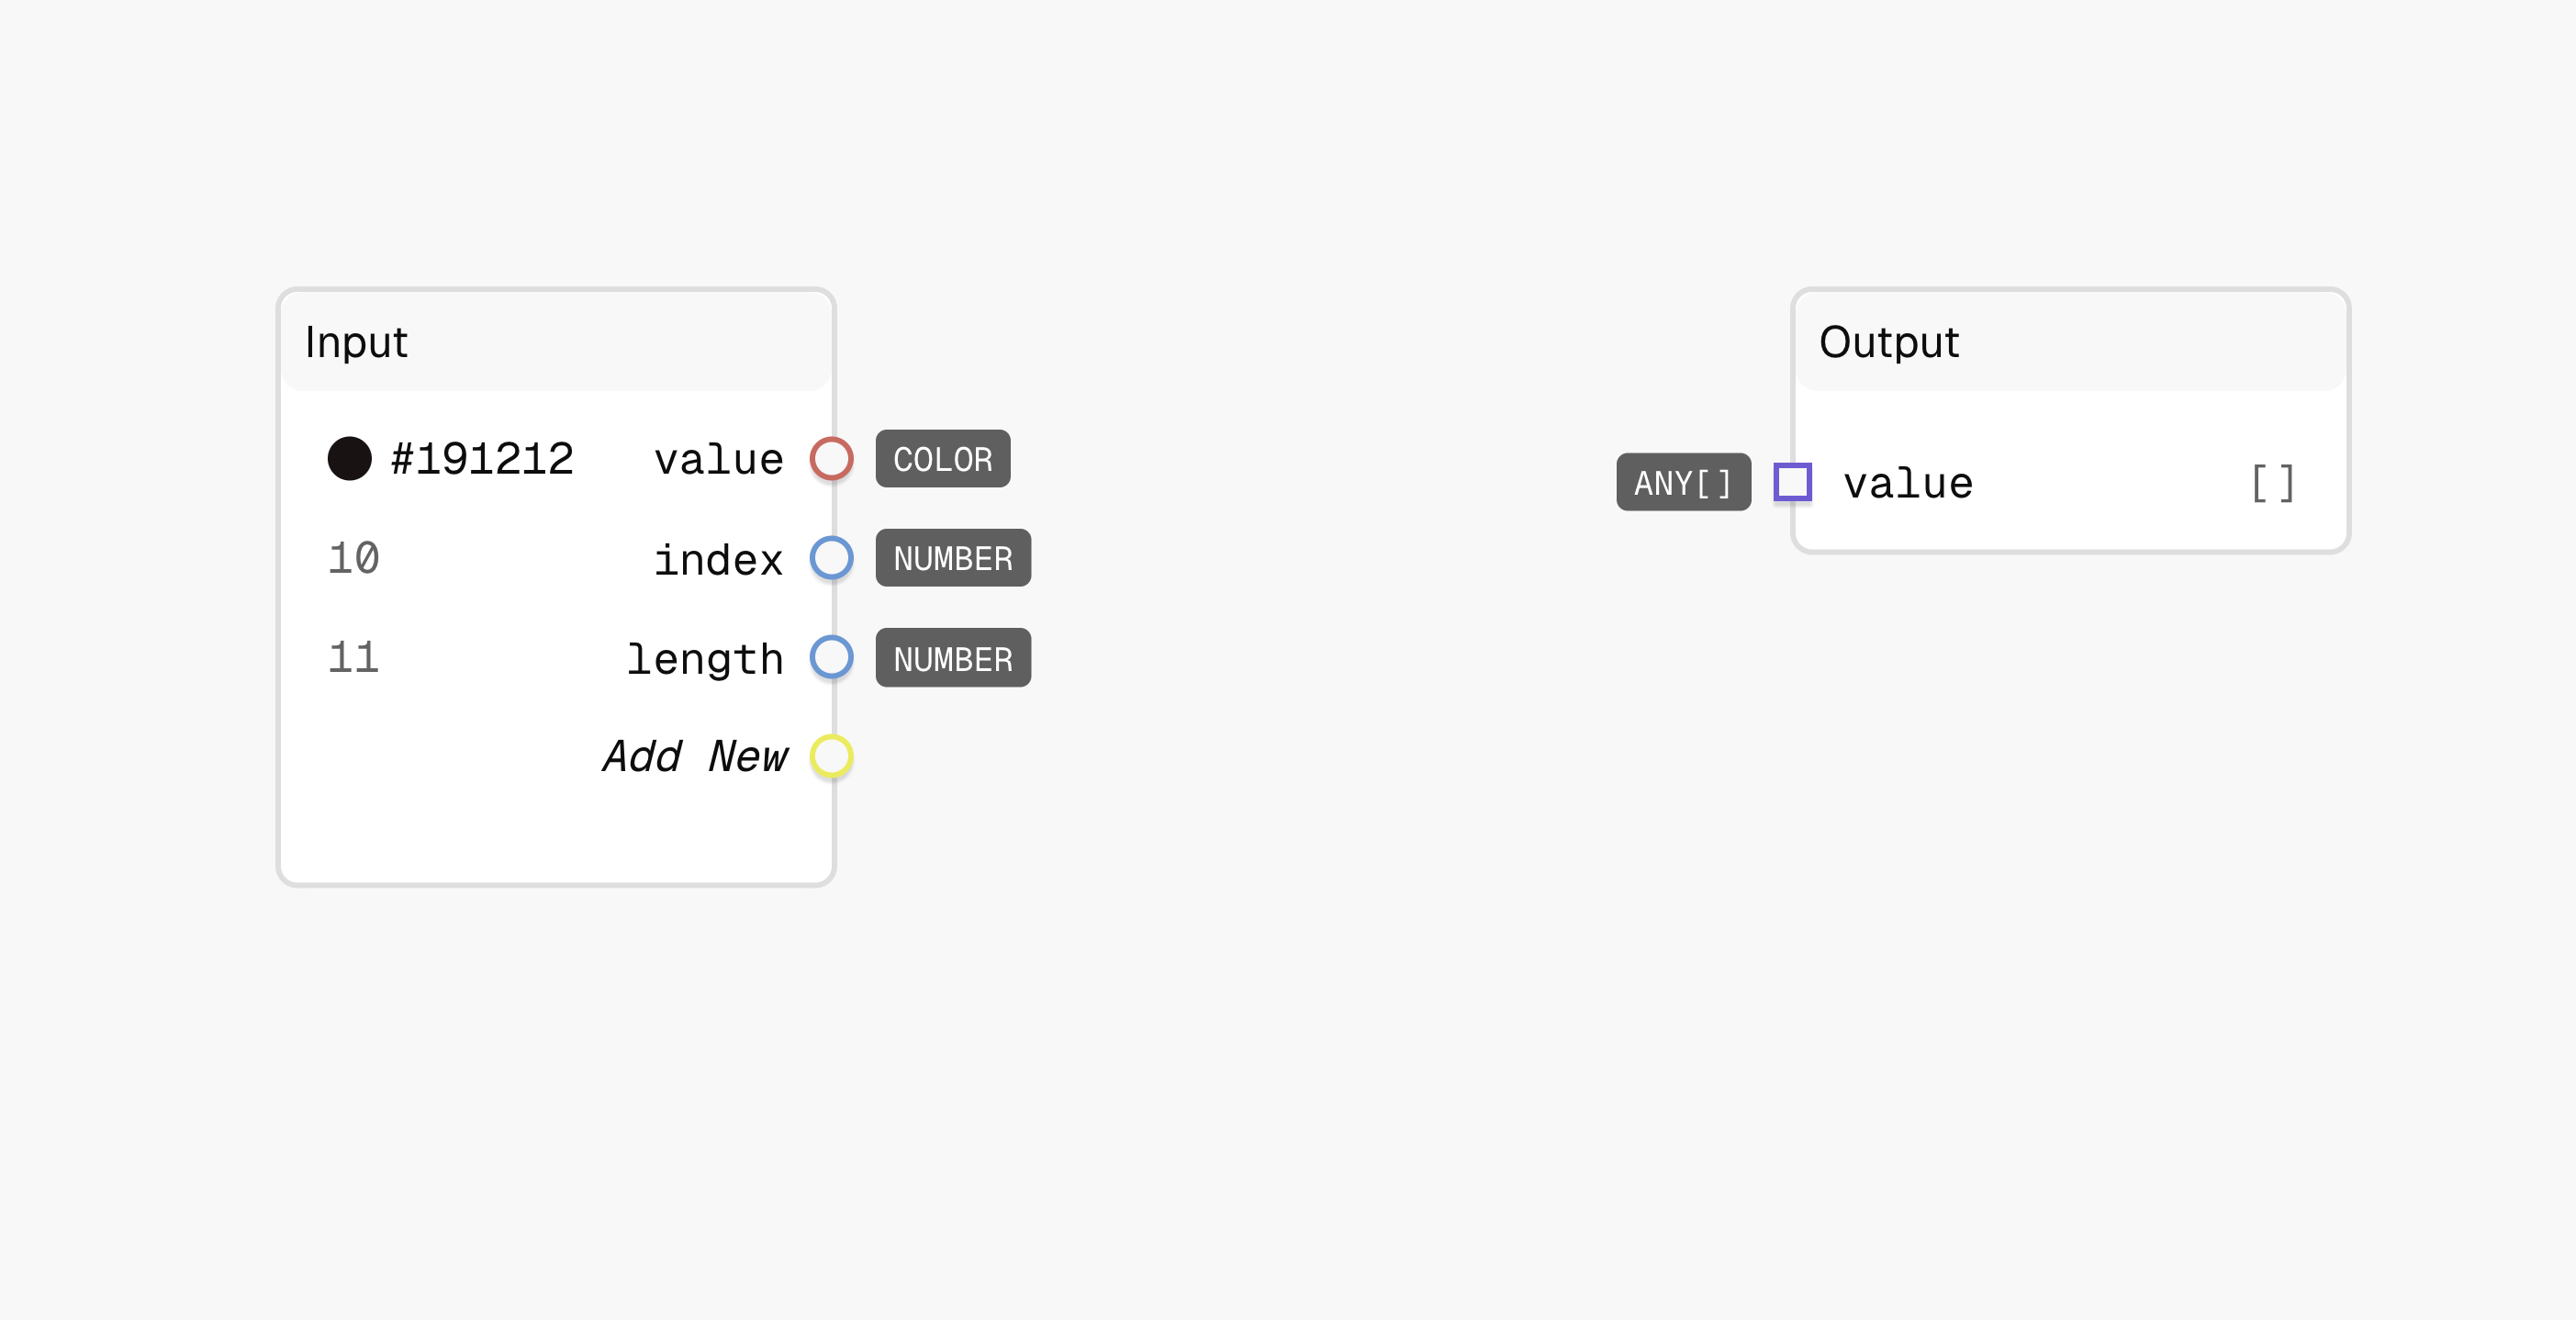
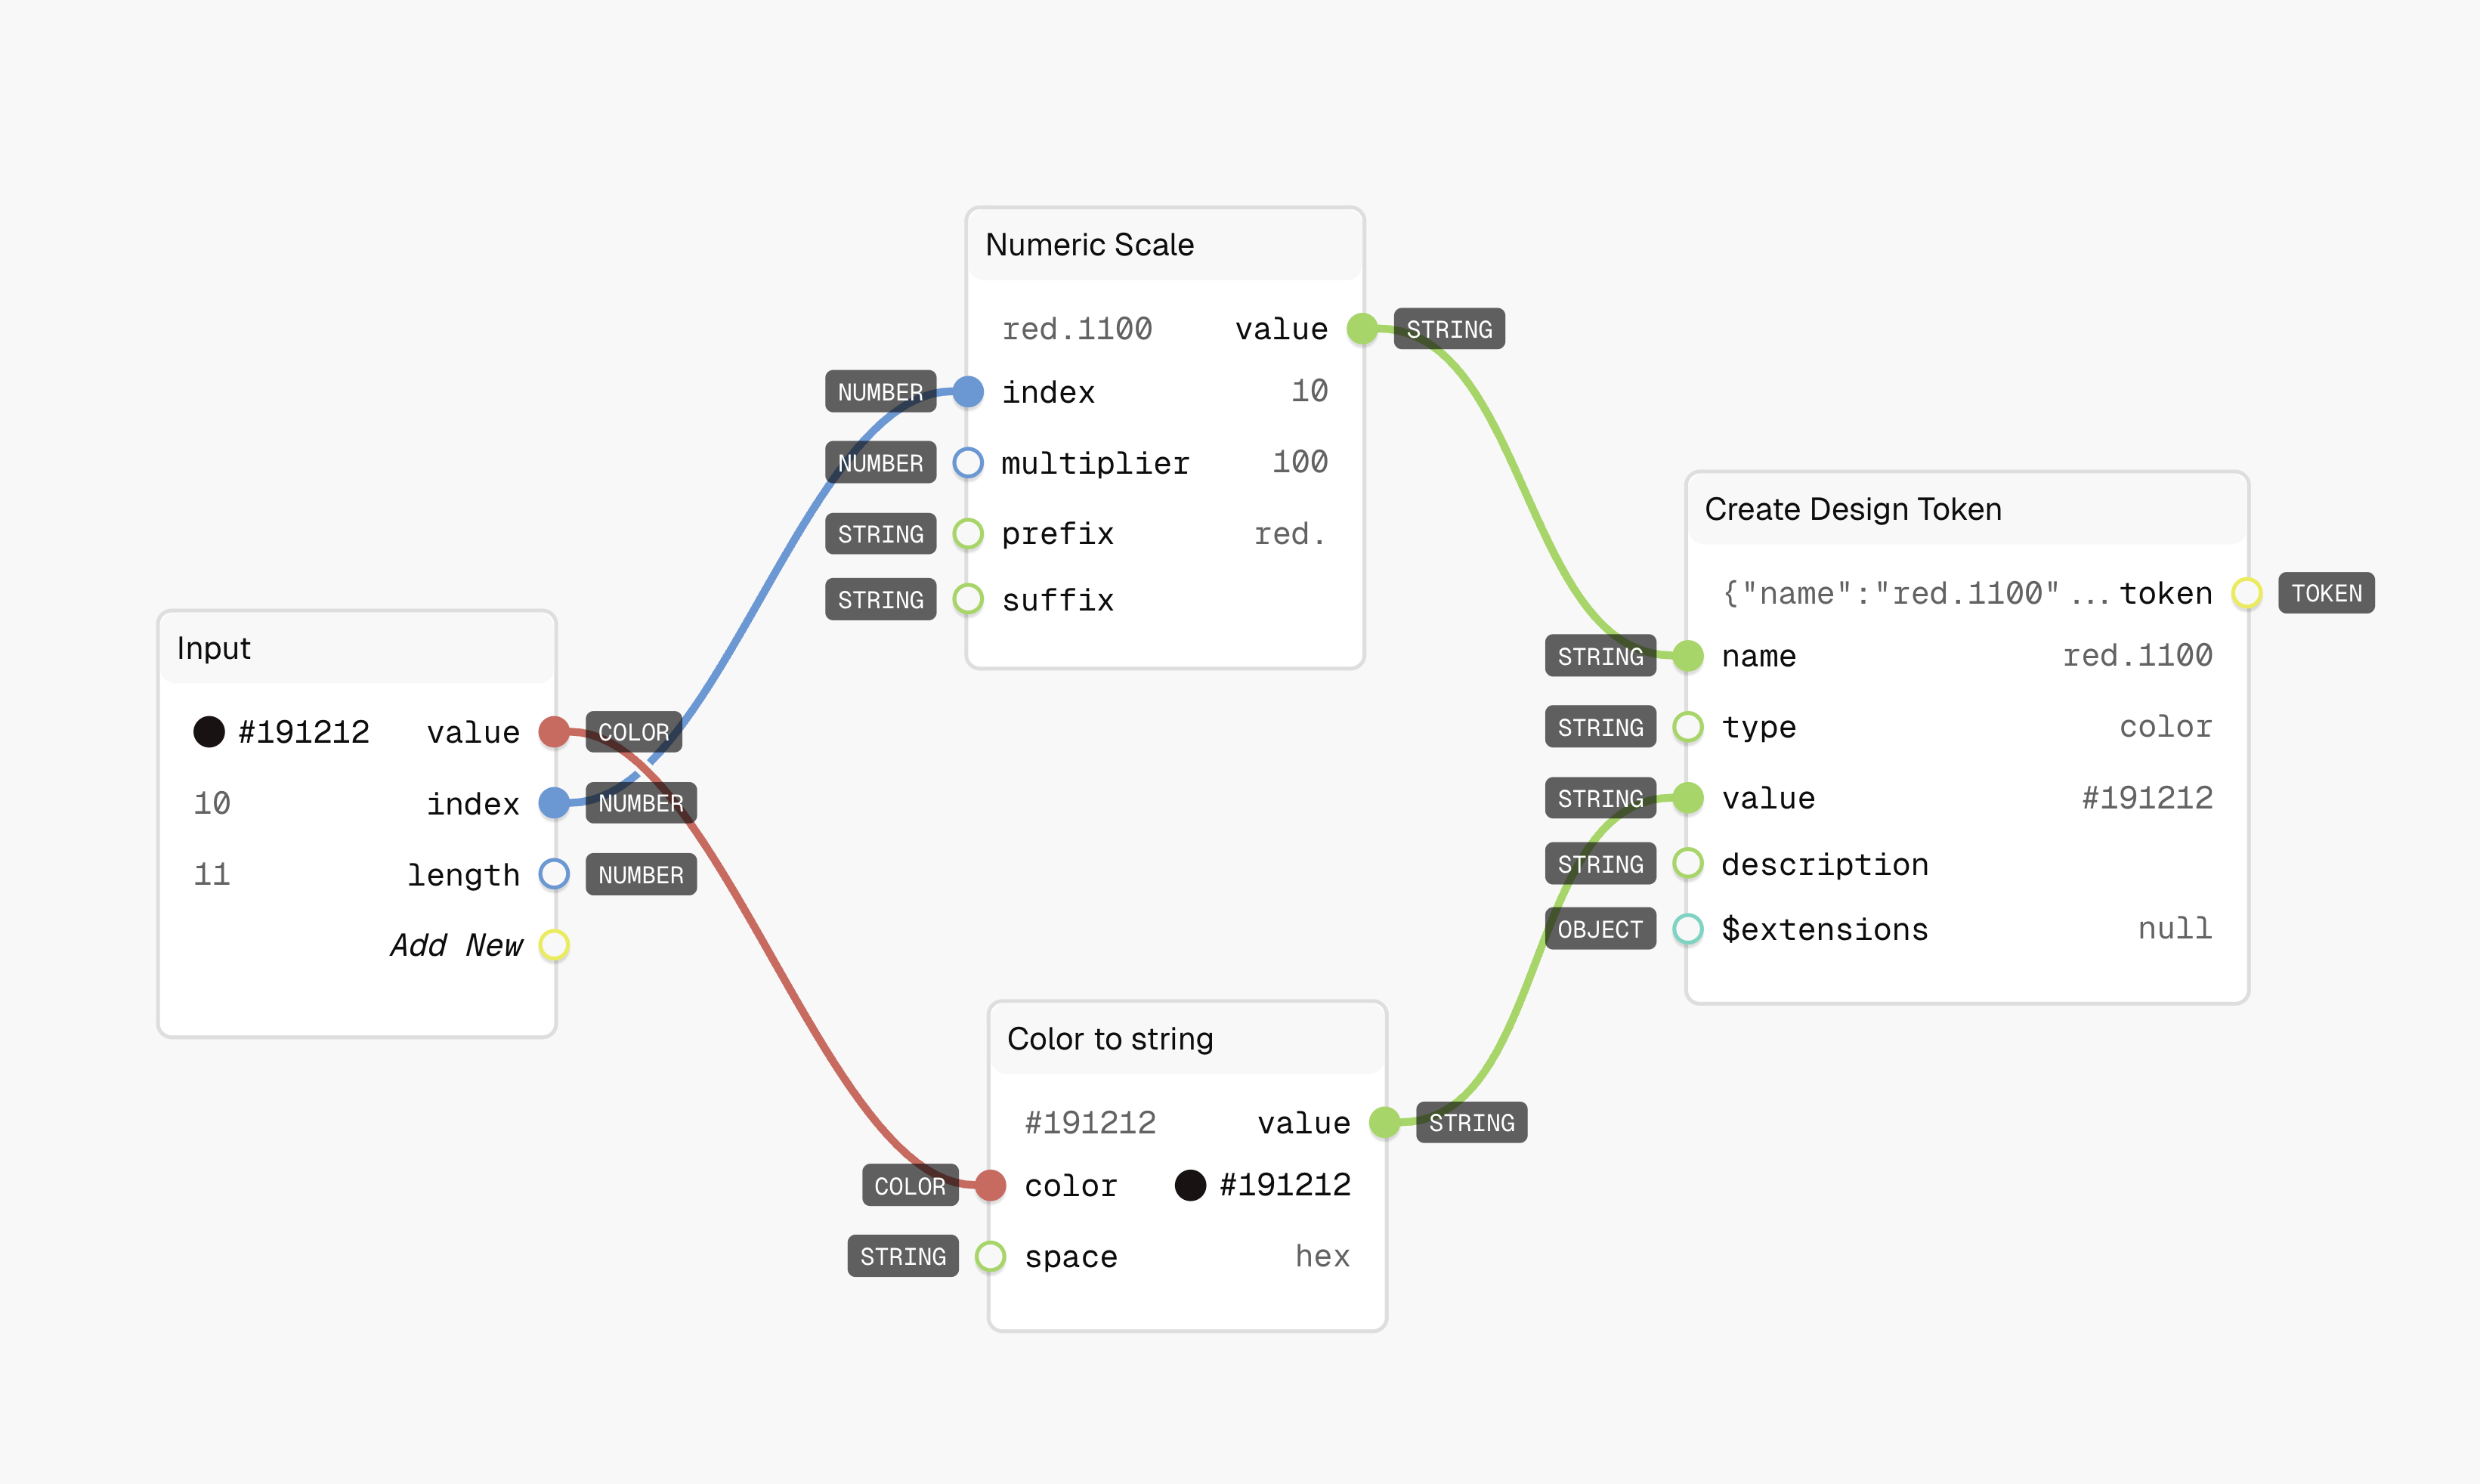
- Inside the Array map we see a input node and an output node.
- The input node inside the Array Map has the following inputs: value, index, length coming in from the Scale Color node. In the image below, we see a color with value
#191212at index10and the length of the array11.
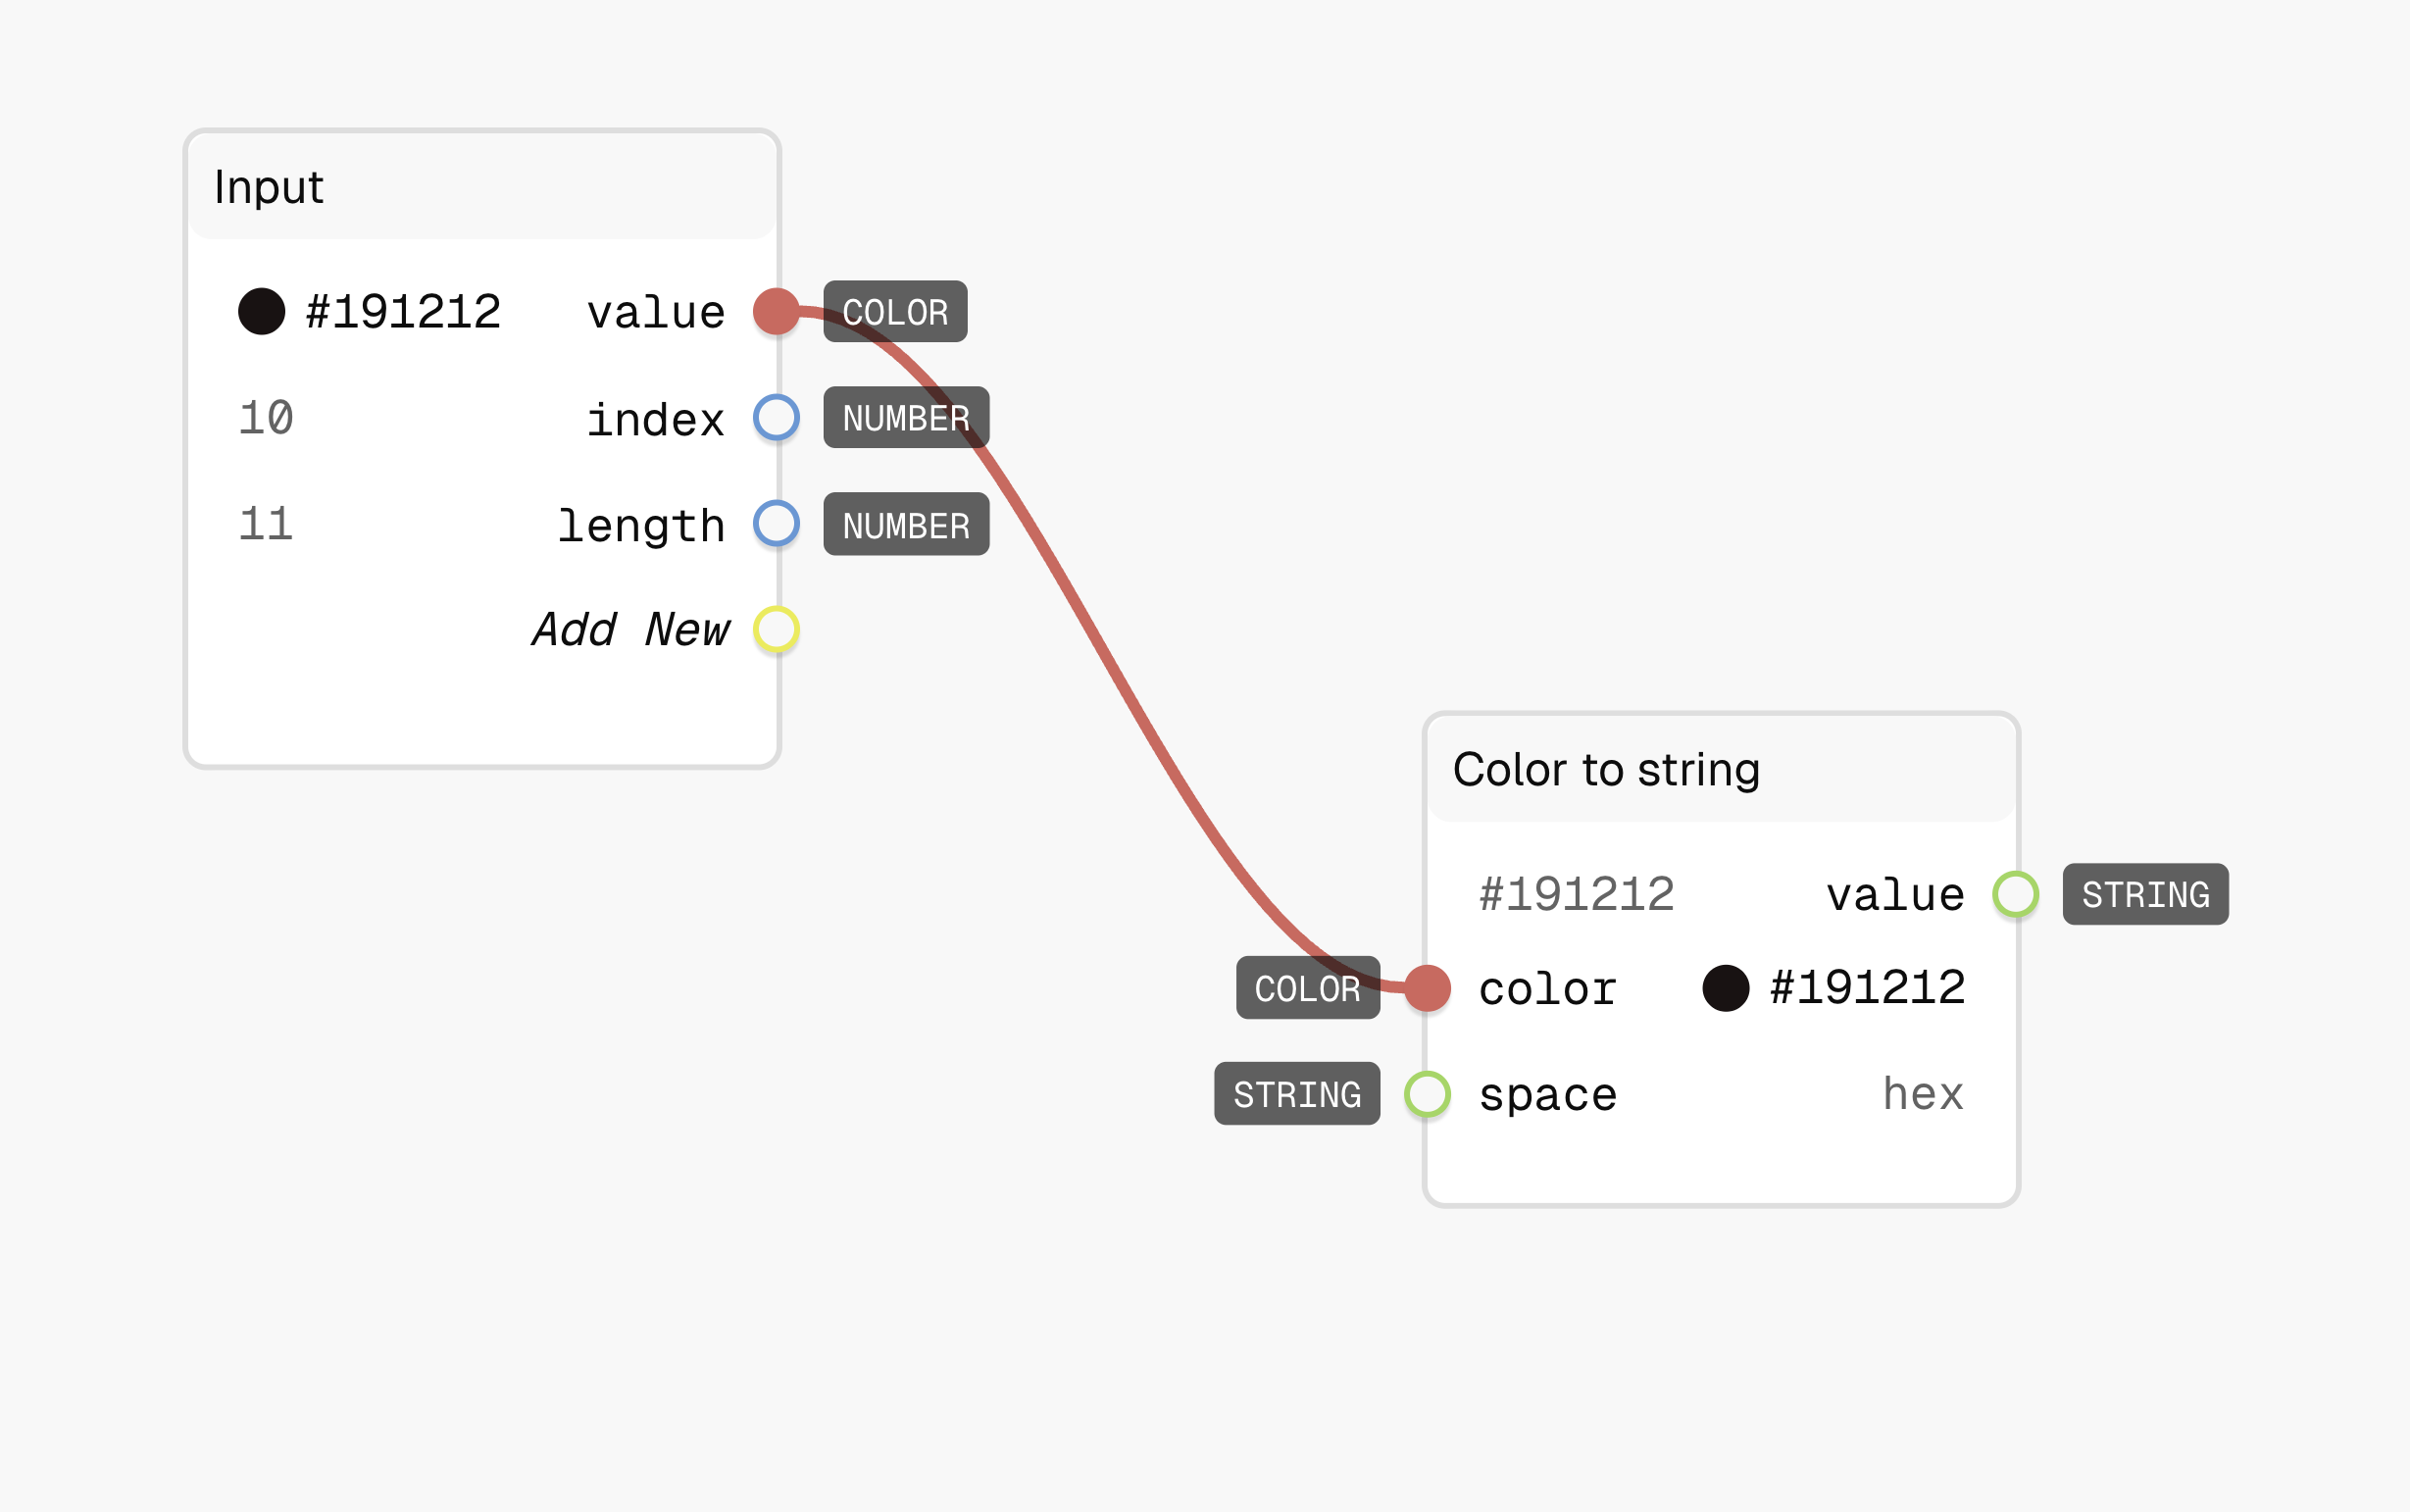
- To create a design token we need to have the value as a string type, at this point the value that we have is a color type.
- To convert a color to string we will use a Color to string node. Drag the Color to string node into the graph and connect the value from the input node to the color node. This will give us an output which is a string.
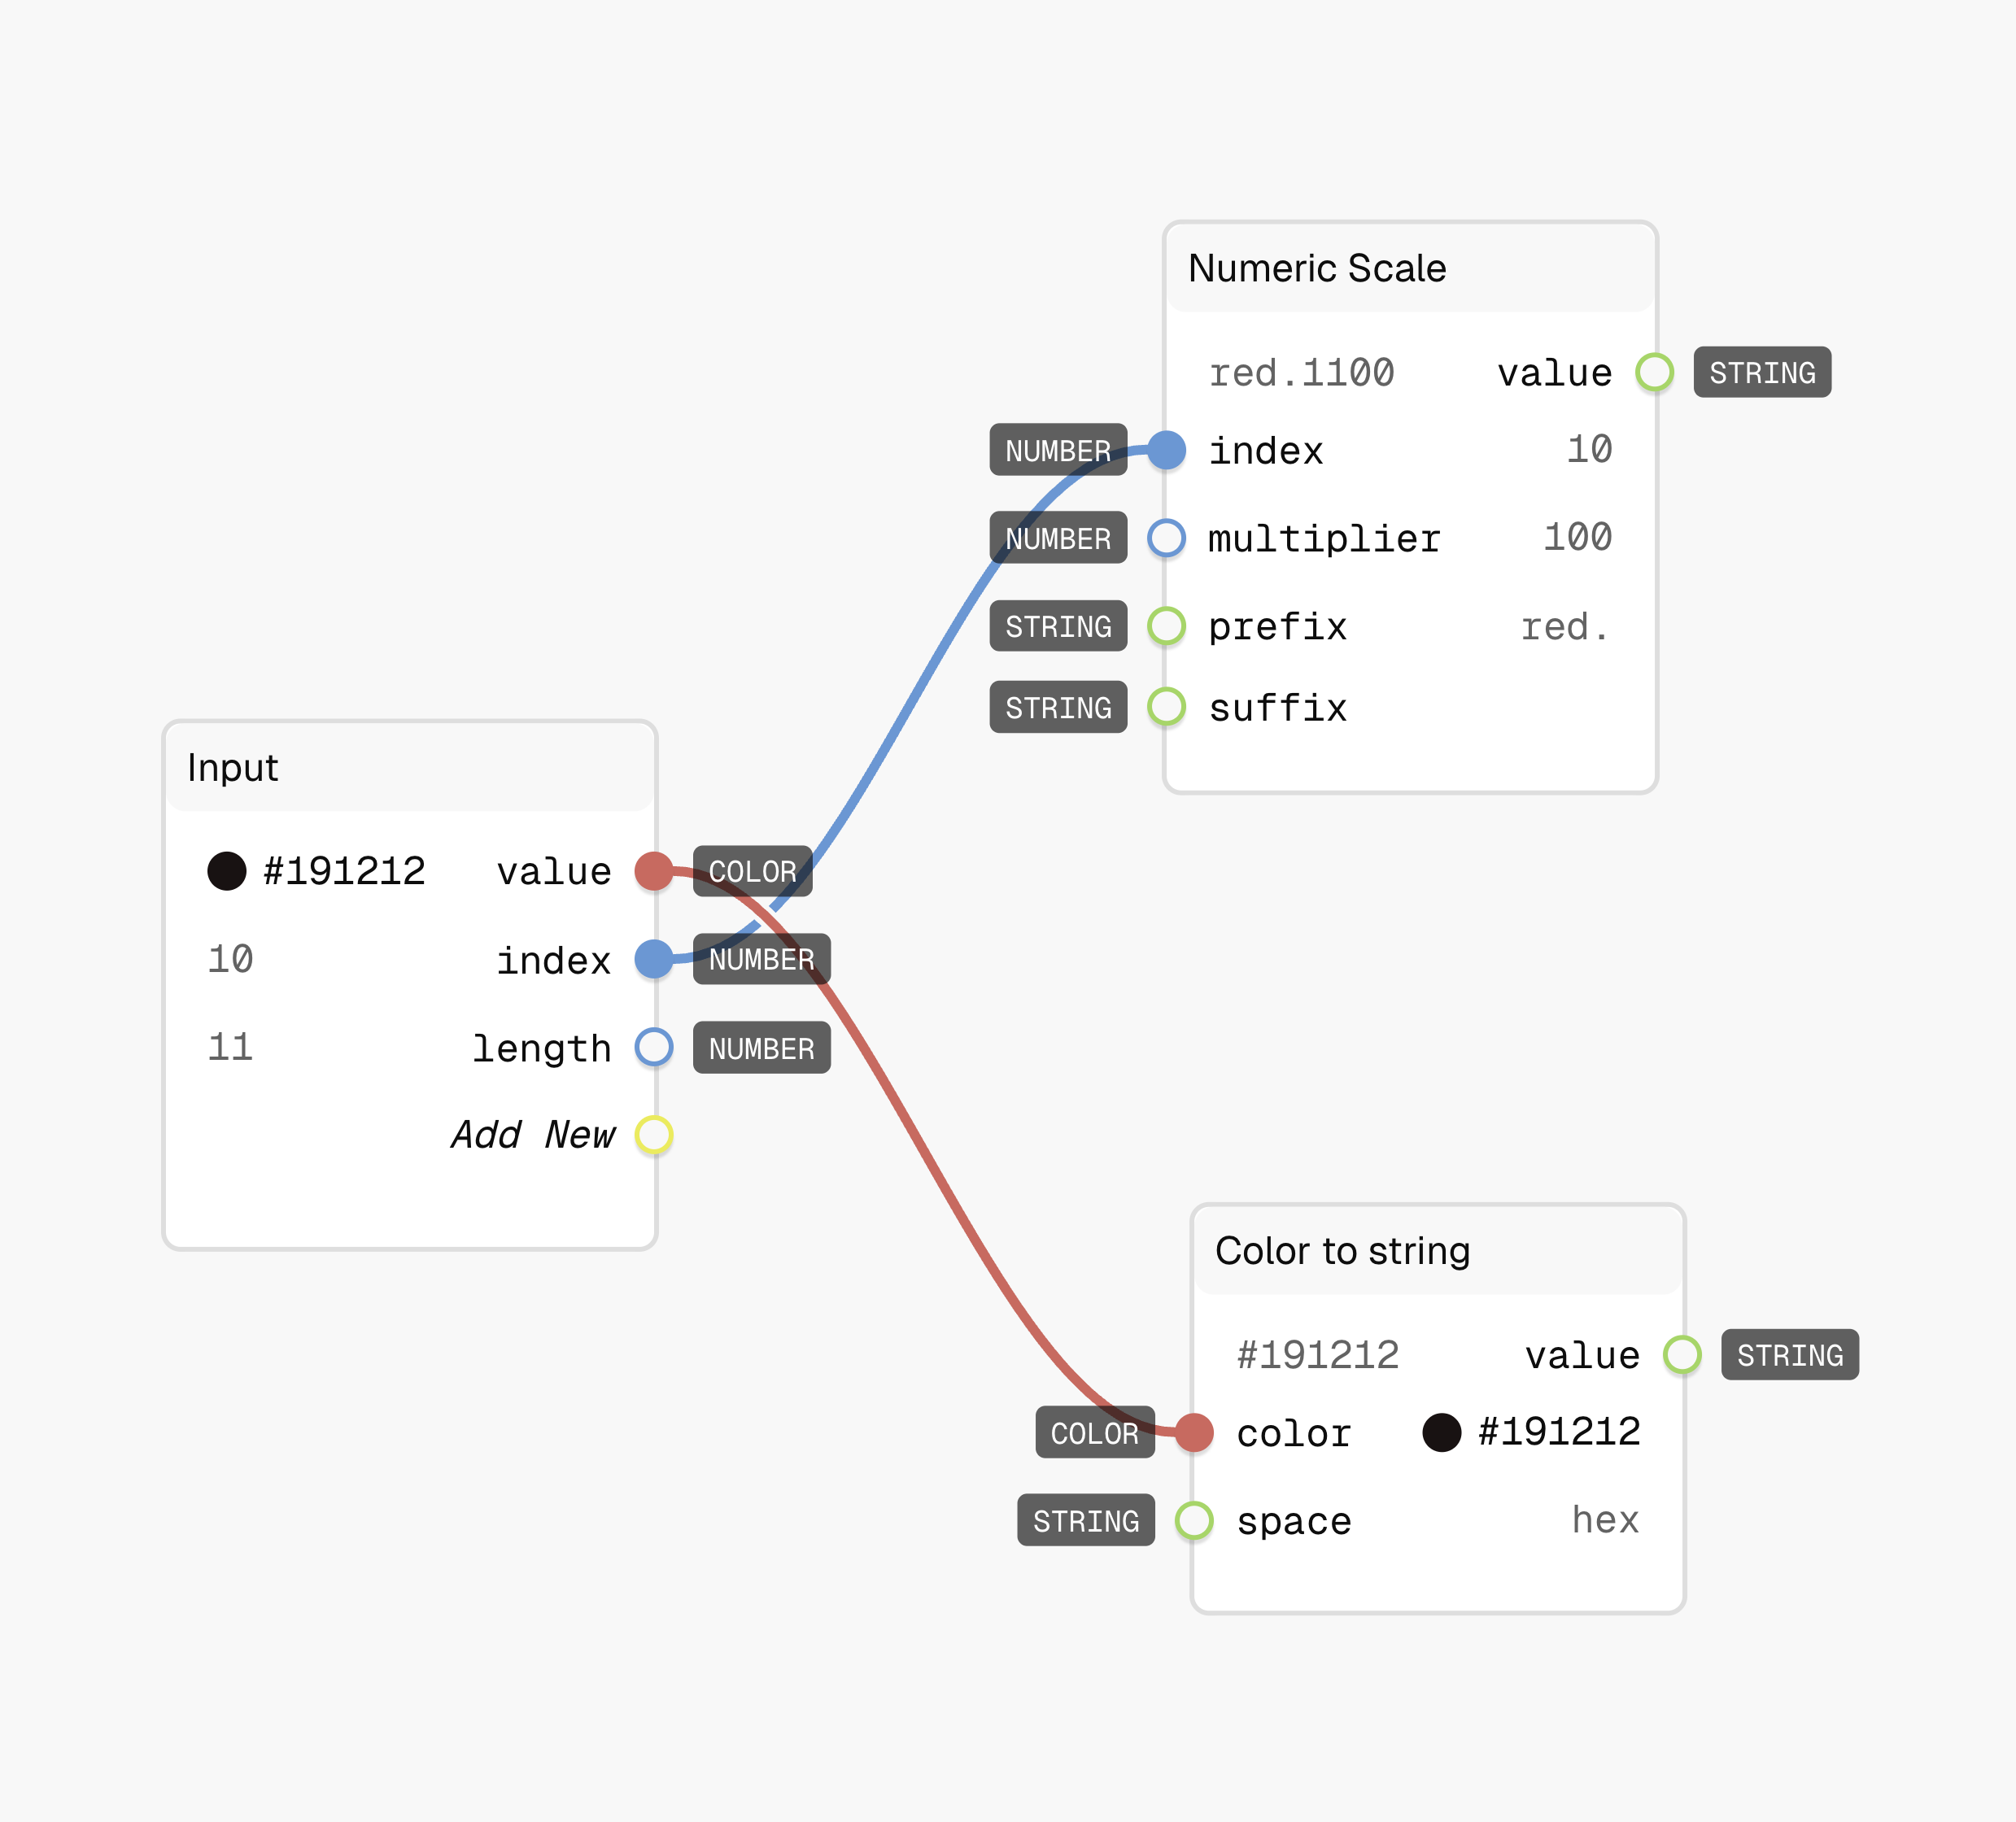
- There are various ways that we can name the design token, for this example we will use the Numeric scale node.
- The Numeric scale node allows us the option to have a multiplier, a prefix and a suffix.
- Drag a Numeric scale node into your graph. Connect the index from the input to the index of the Numeric scale node. We will add a multiplier of
100and a prefix ofred.to have a naming convention likered.100if the index is1.
- Now we have the value and the name that we want to assign to our design token. To create a design token drag in the node Create Design Token into the graph.
- Connect the output from the Numeric scale to the input called "name" in the Create Design Token node.
- Connect the output from the Color to String node to the input name "value" in the Create Design Token node.
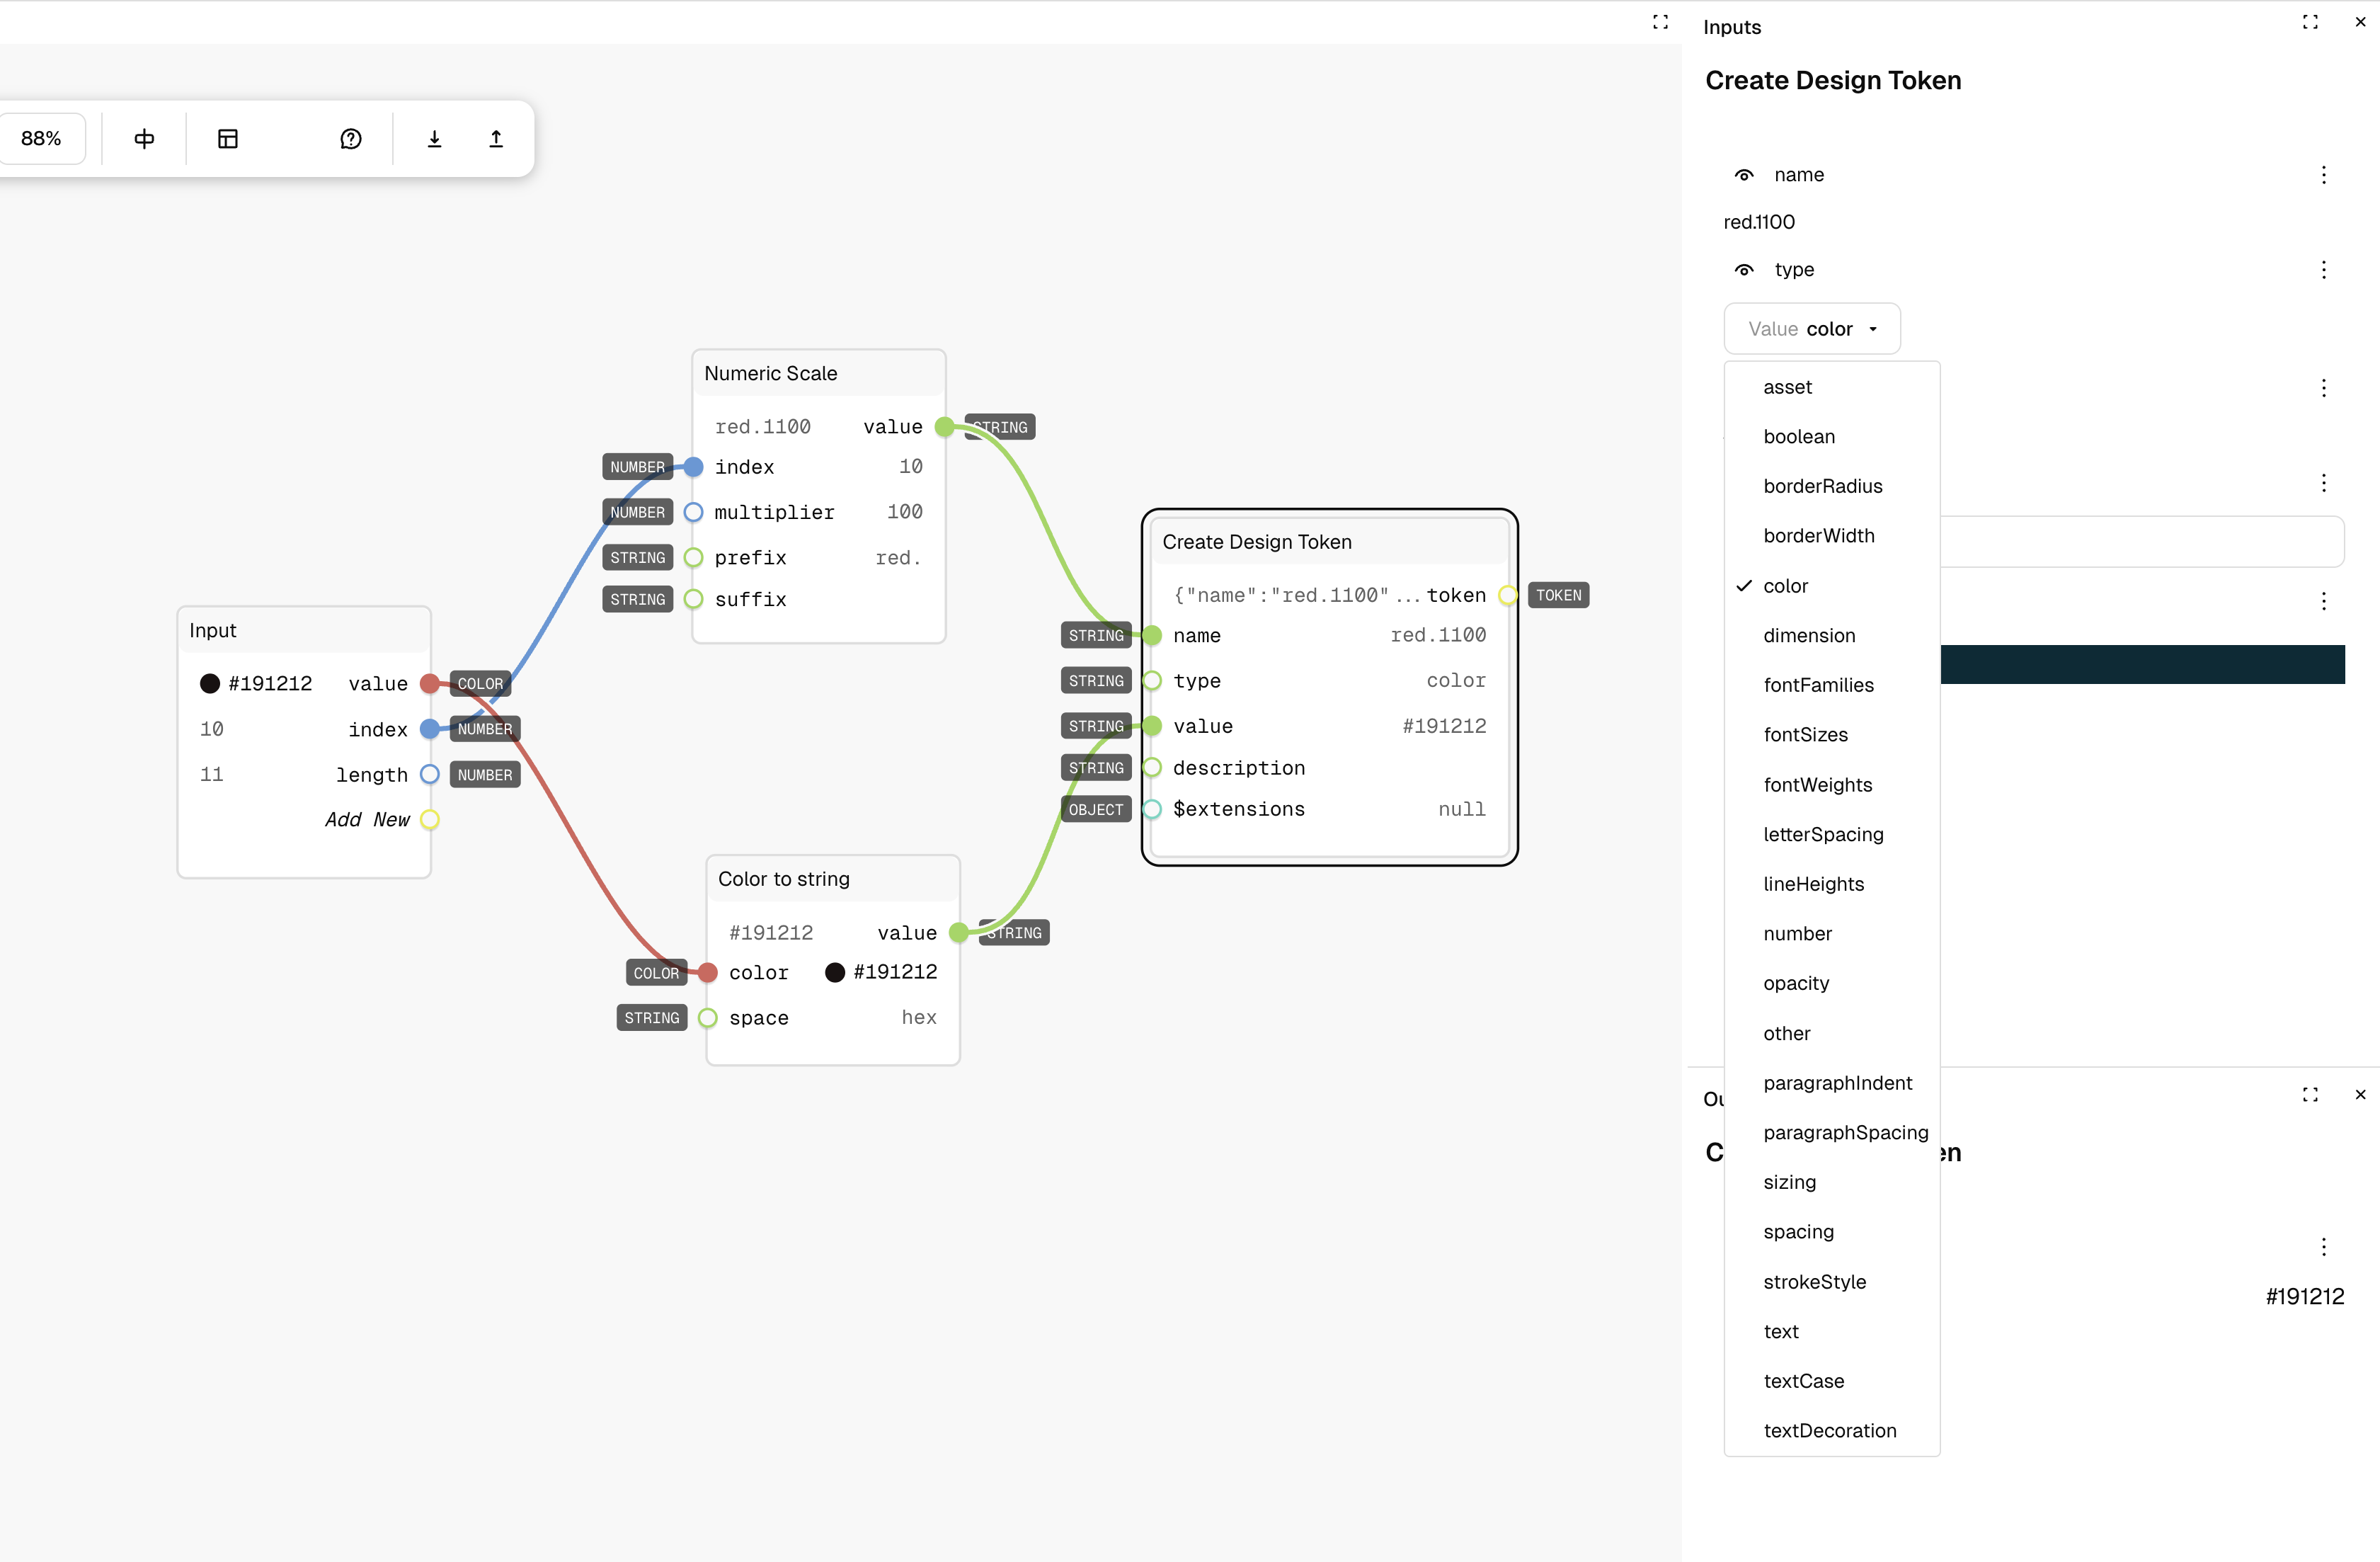
- Set the type as "color" on the node from the input panel in the right, this is to create a color design token.
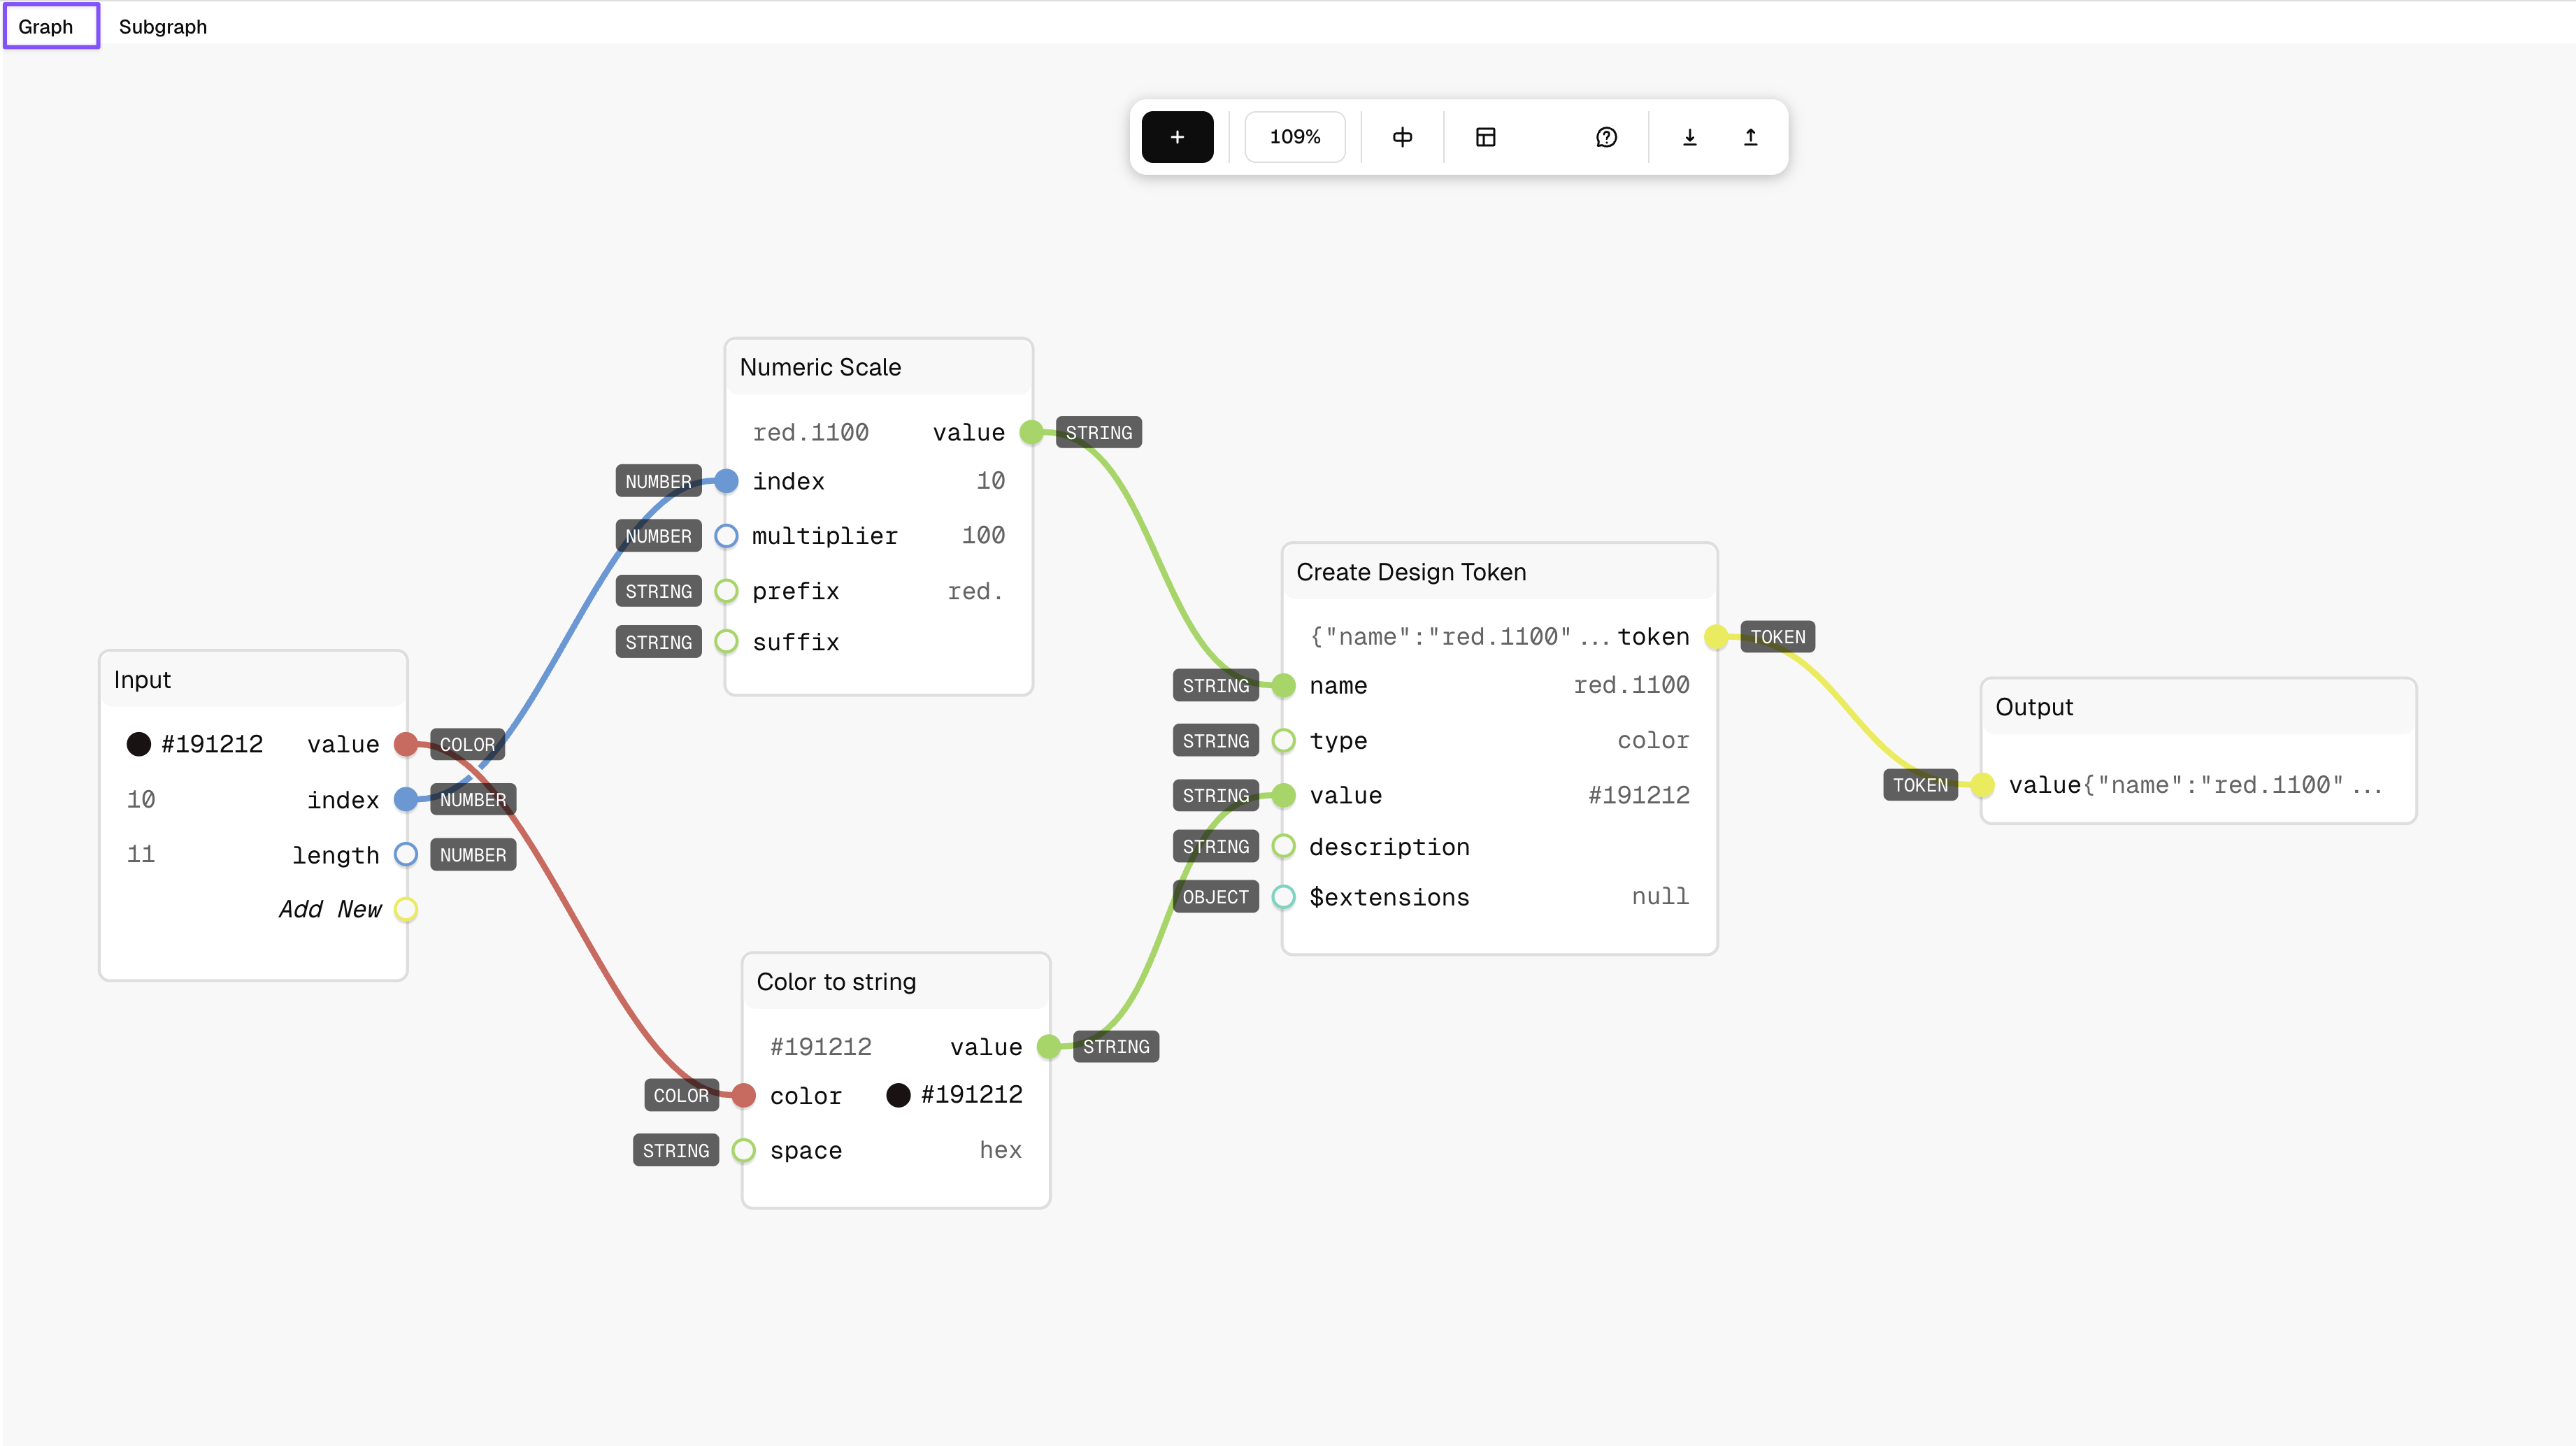
- Now we have created a Design Token. Connect the output of the node to the output node that was present in the Array Map.
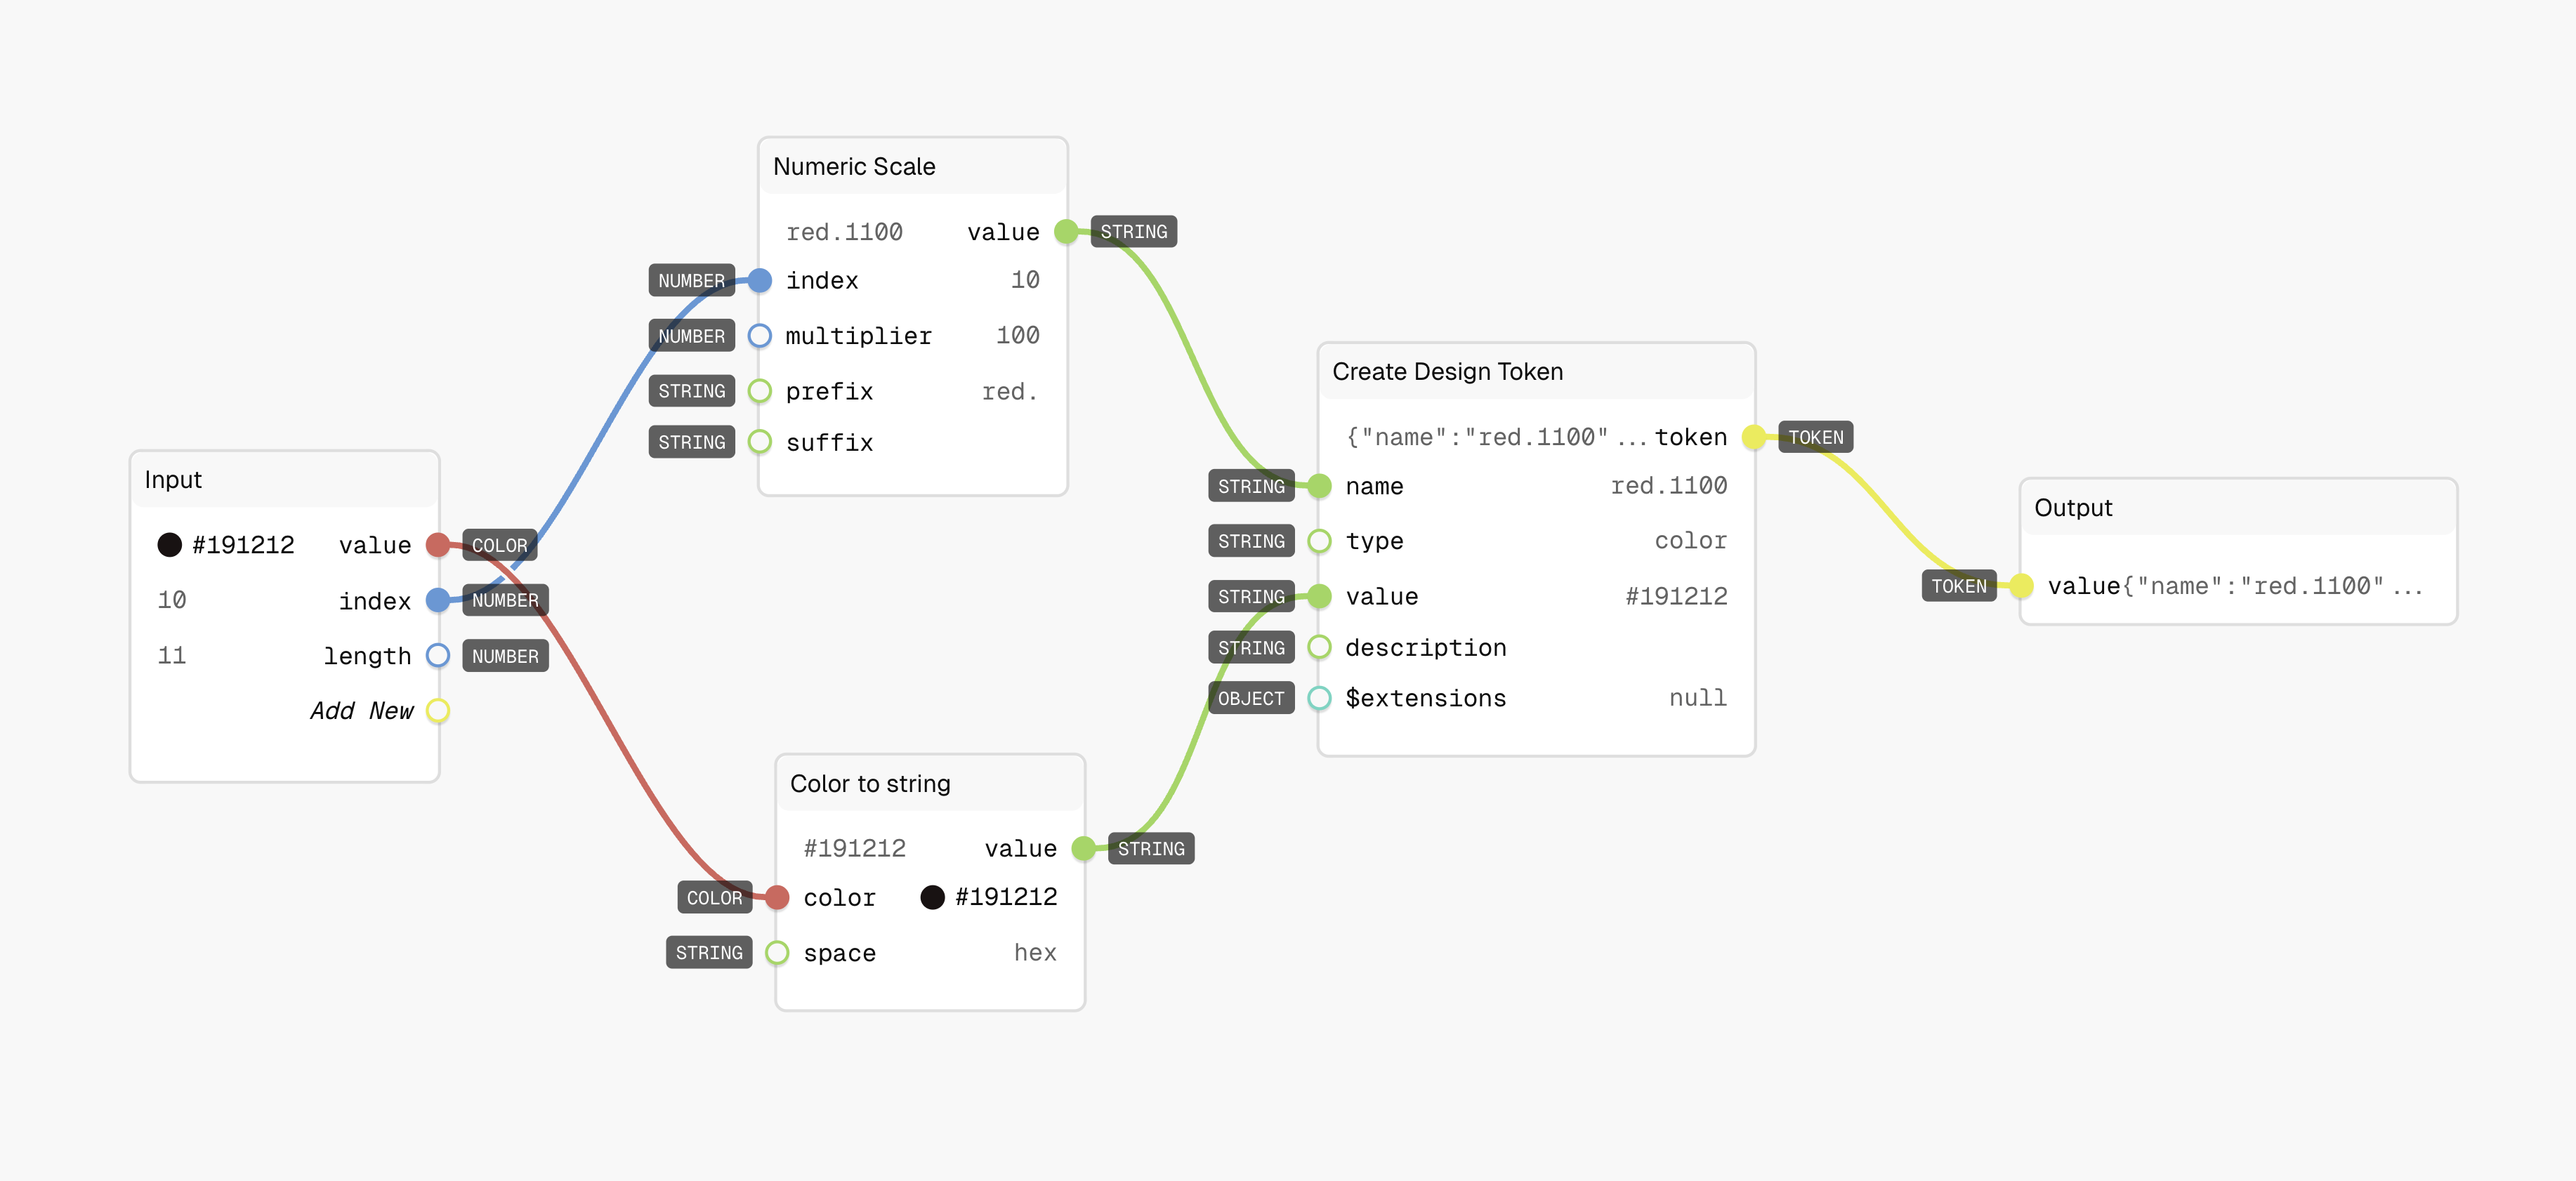
- The output of the Array Map can be seen by clicking on the original graph.
- On the original graph right-click the Array Map node and click on "Force Execution" to ensure that all the nodes inside the Array Map are executed on each item of our list from Scale Colors node.
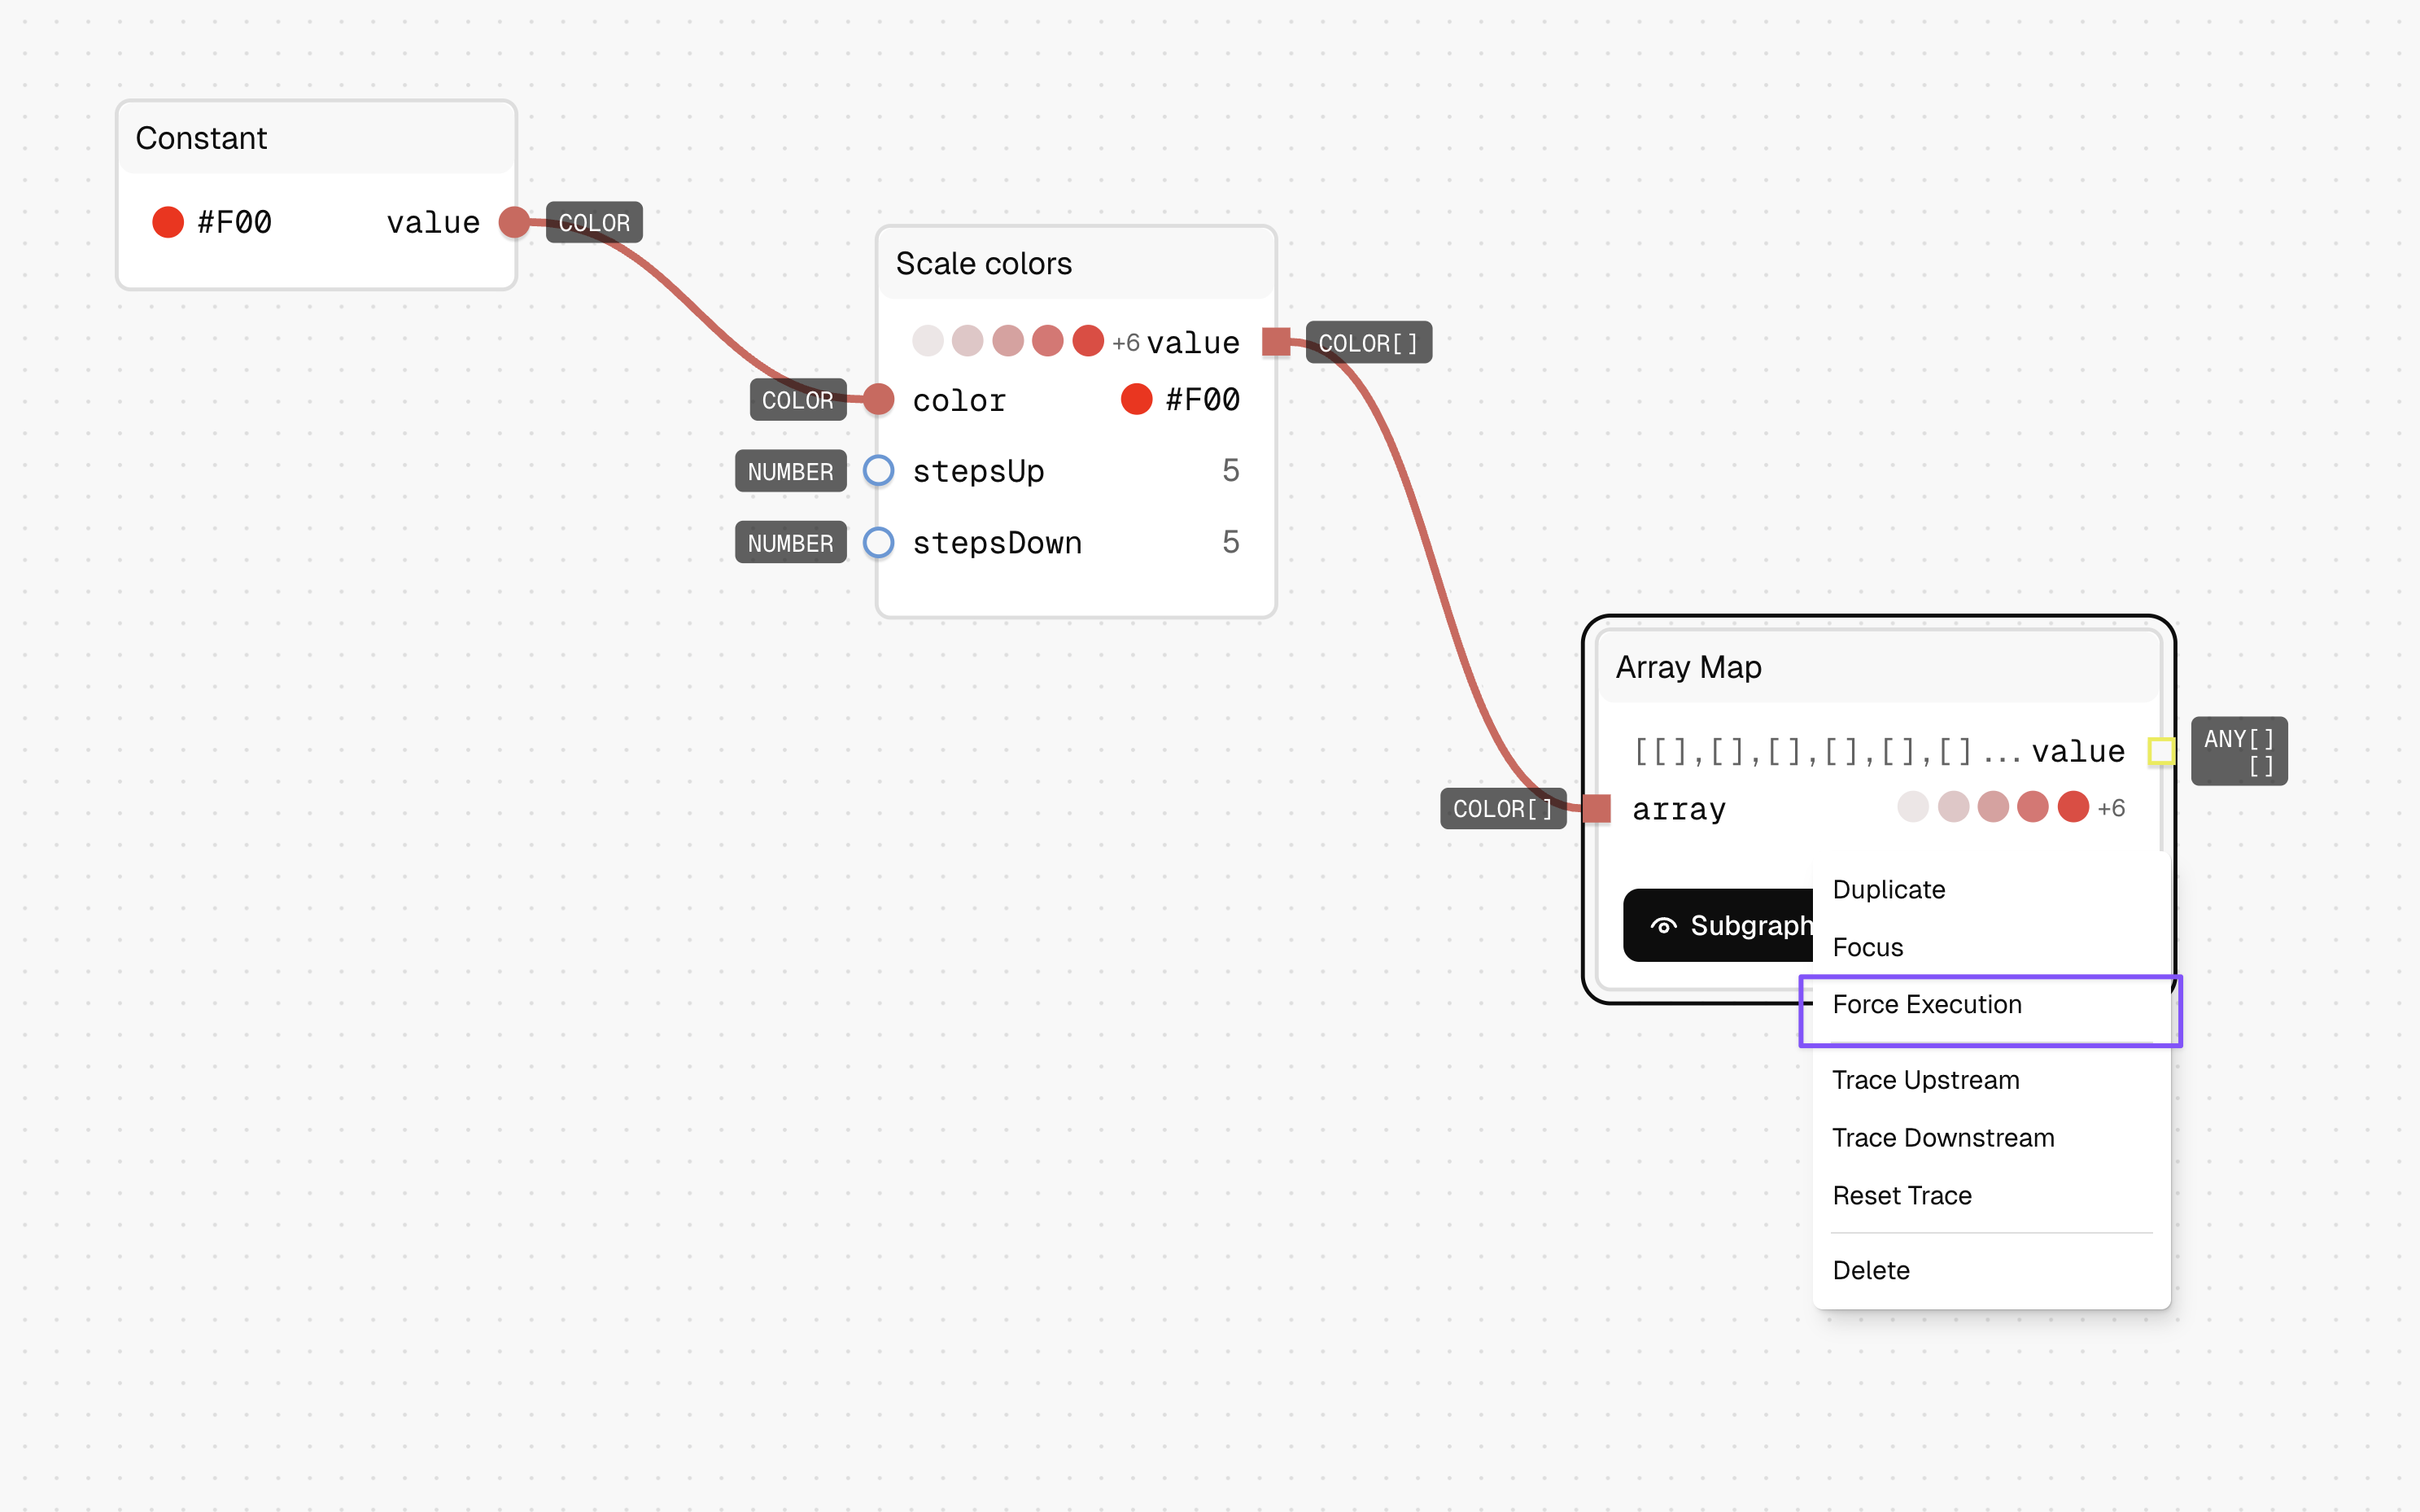
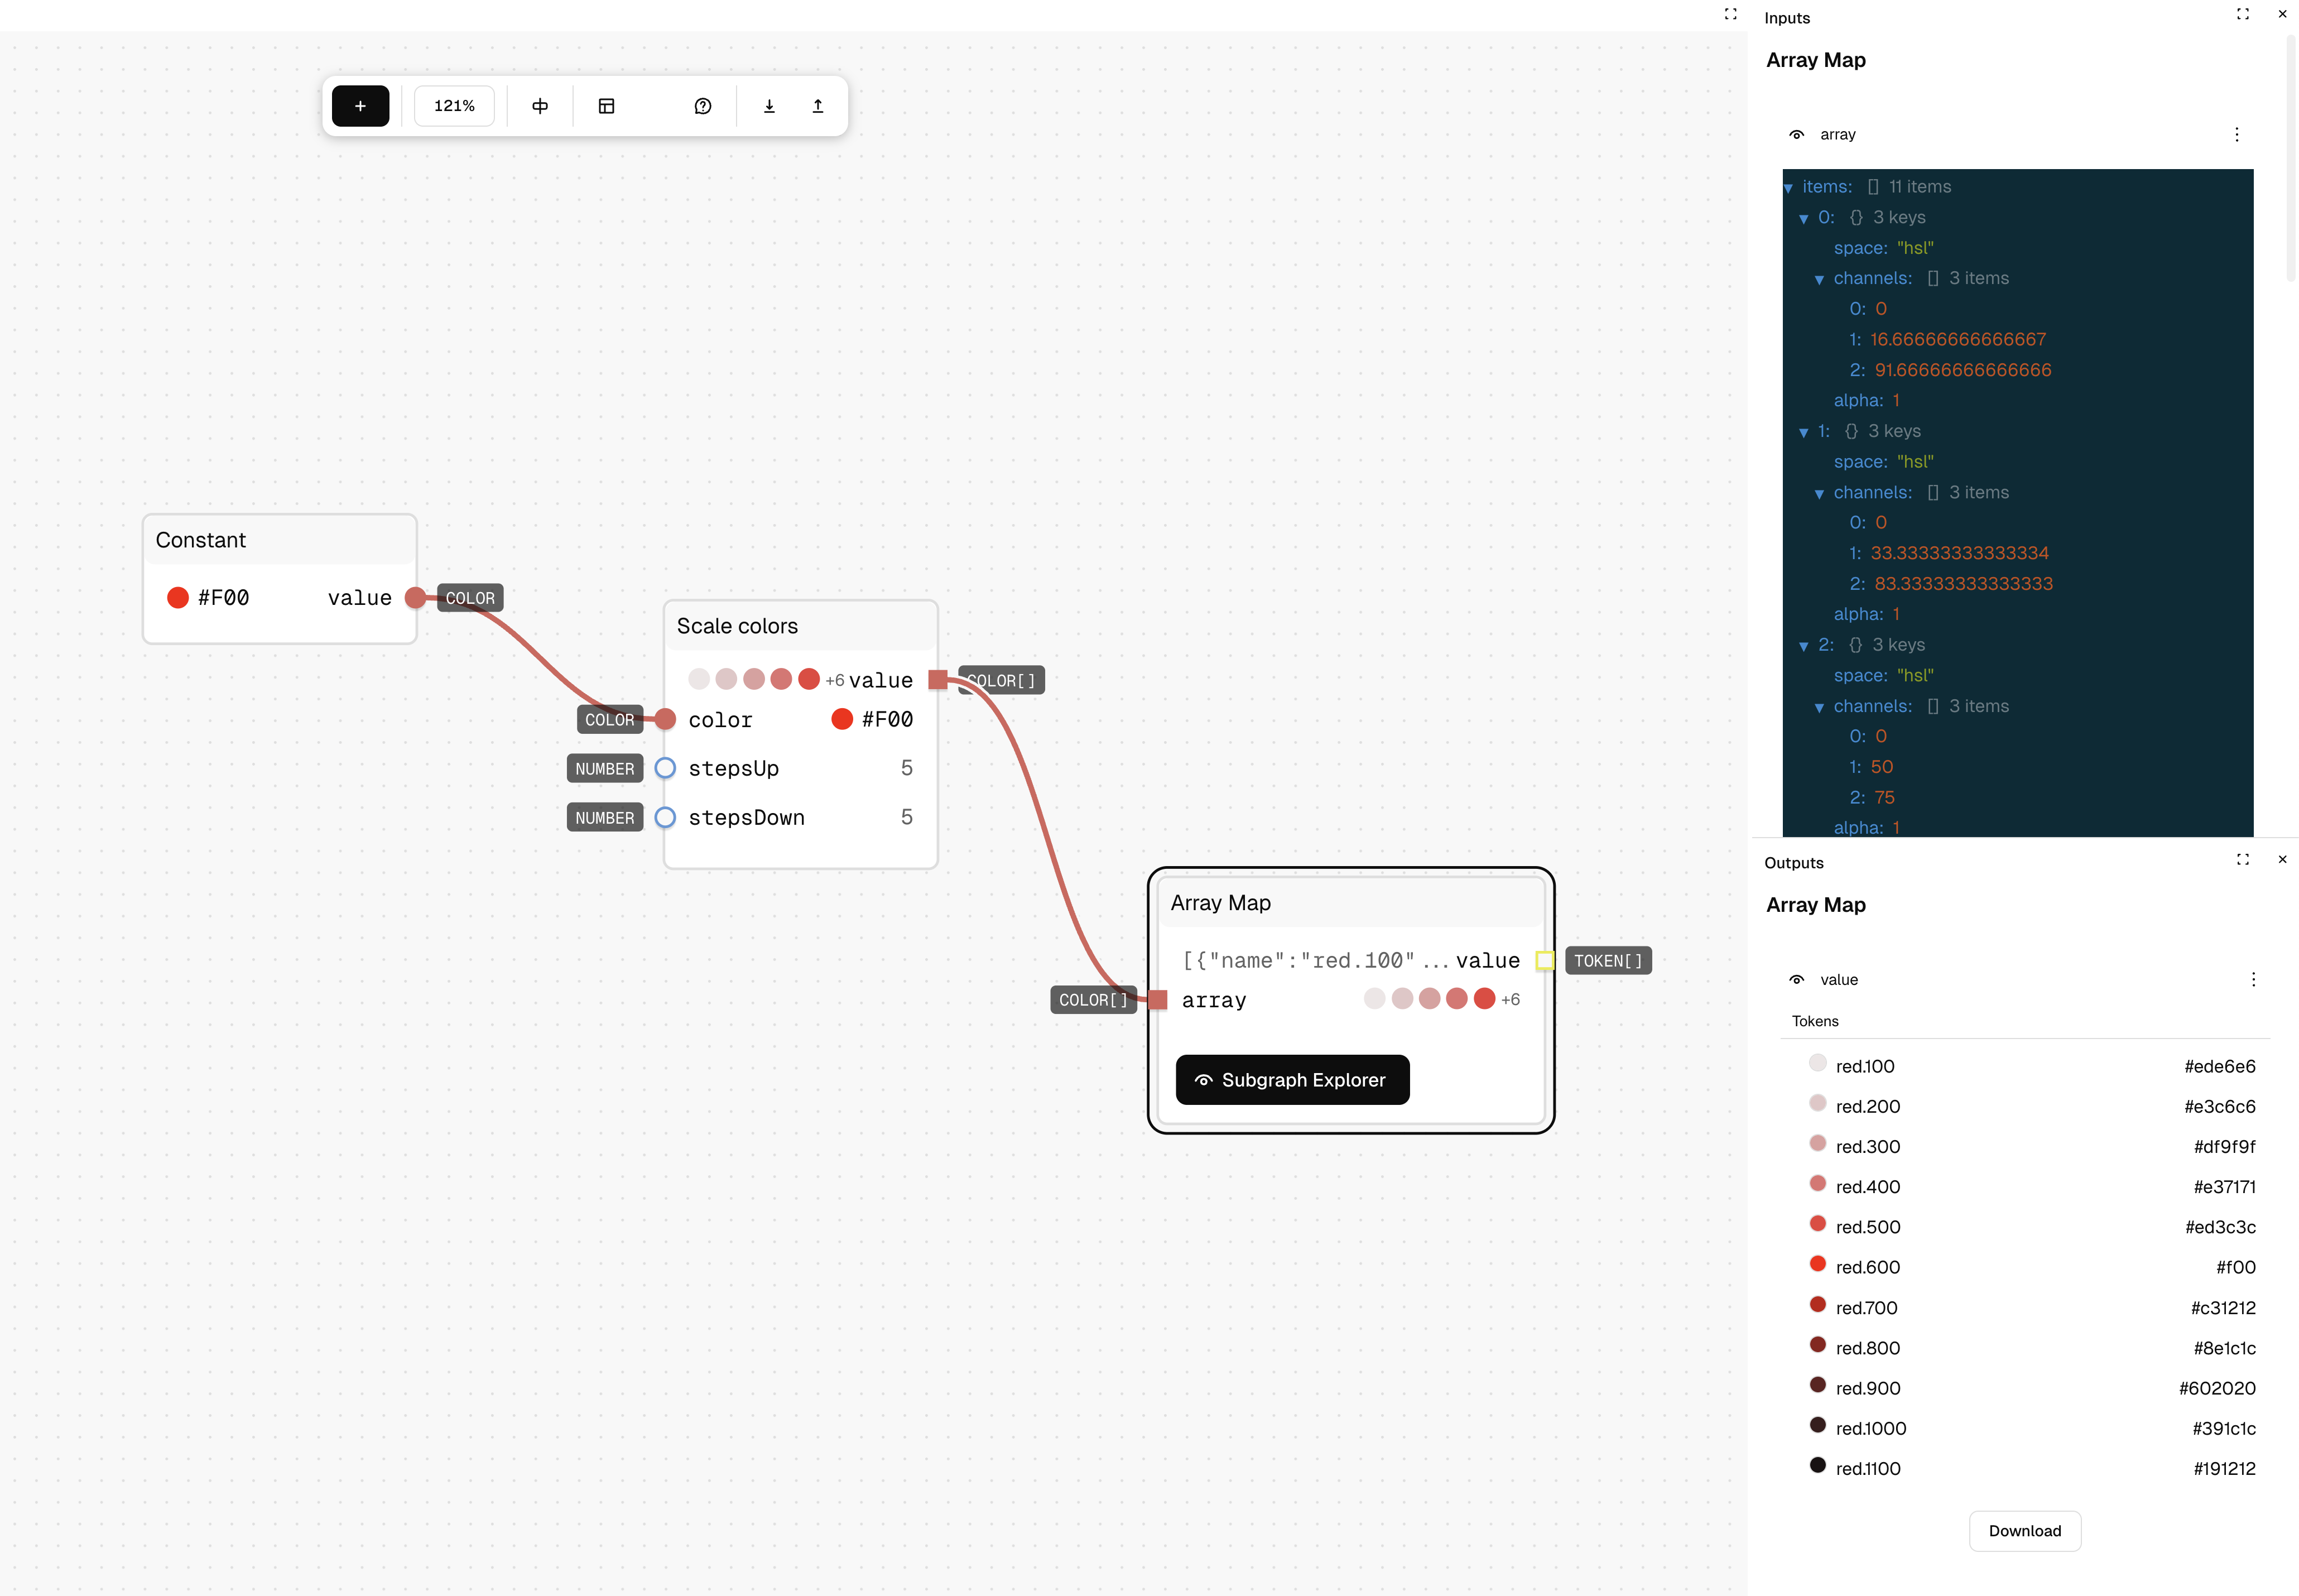
- The output of the Array Map will have a list of design tokens with the naming convention that we have created. Each color from the Scale colors node has been transformed to a design token with the correct naming.
Step 4: Adding a namespace to the Design Tokens names
- We have the design tokens with the name as
red.100. For this example we want to add a namespace "color" to our design token names (color.red.100). - To do this we will use the Group Token node, this node will let us add a namespace to an array of tokens.
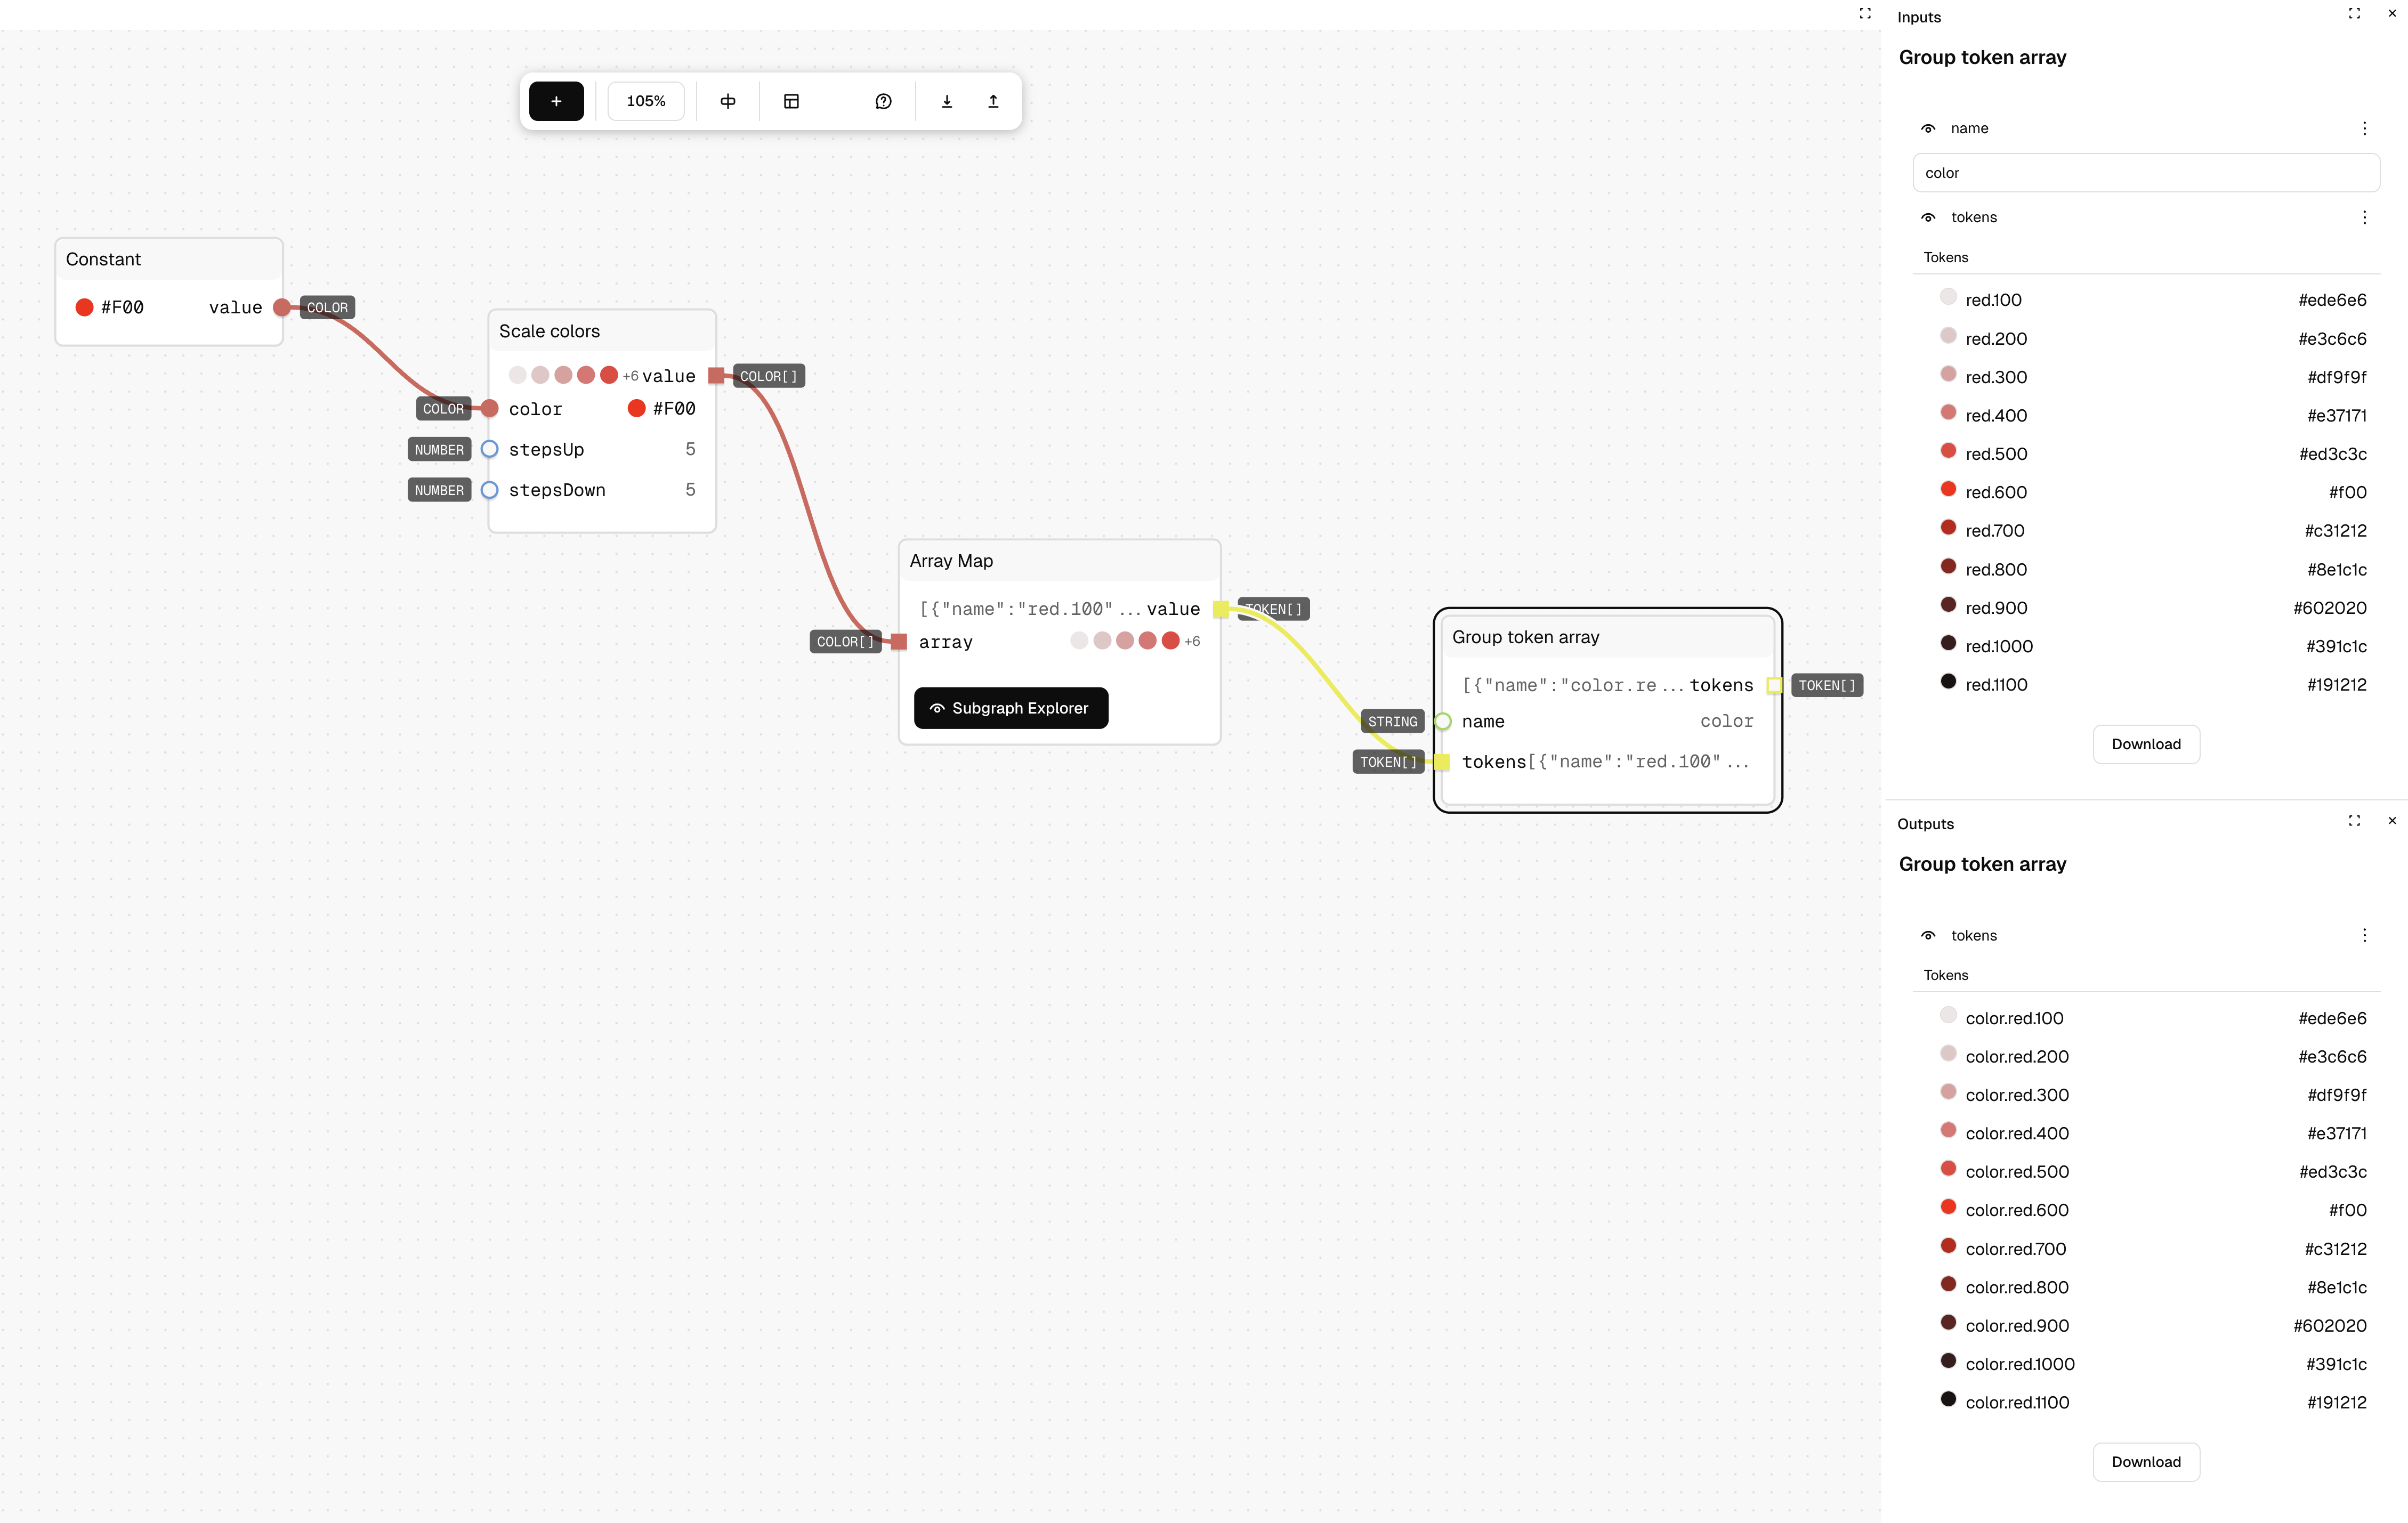
- Drag the Group Tokens node to the graph. In the input of the Group Tokens node, add "color" to the name input.
- The output will be a list of design tokens that has the naming convention of "color.red.100".
Step 5: Creating a token set
- At this point our design tokens are in a list or array. We need to convert the list to a token set before getting the final output.
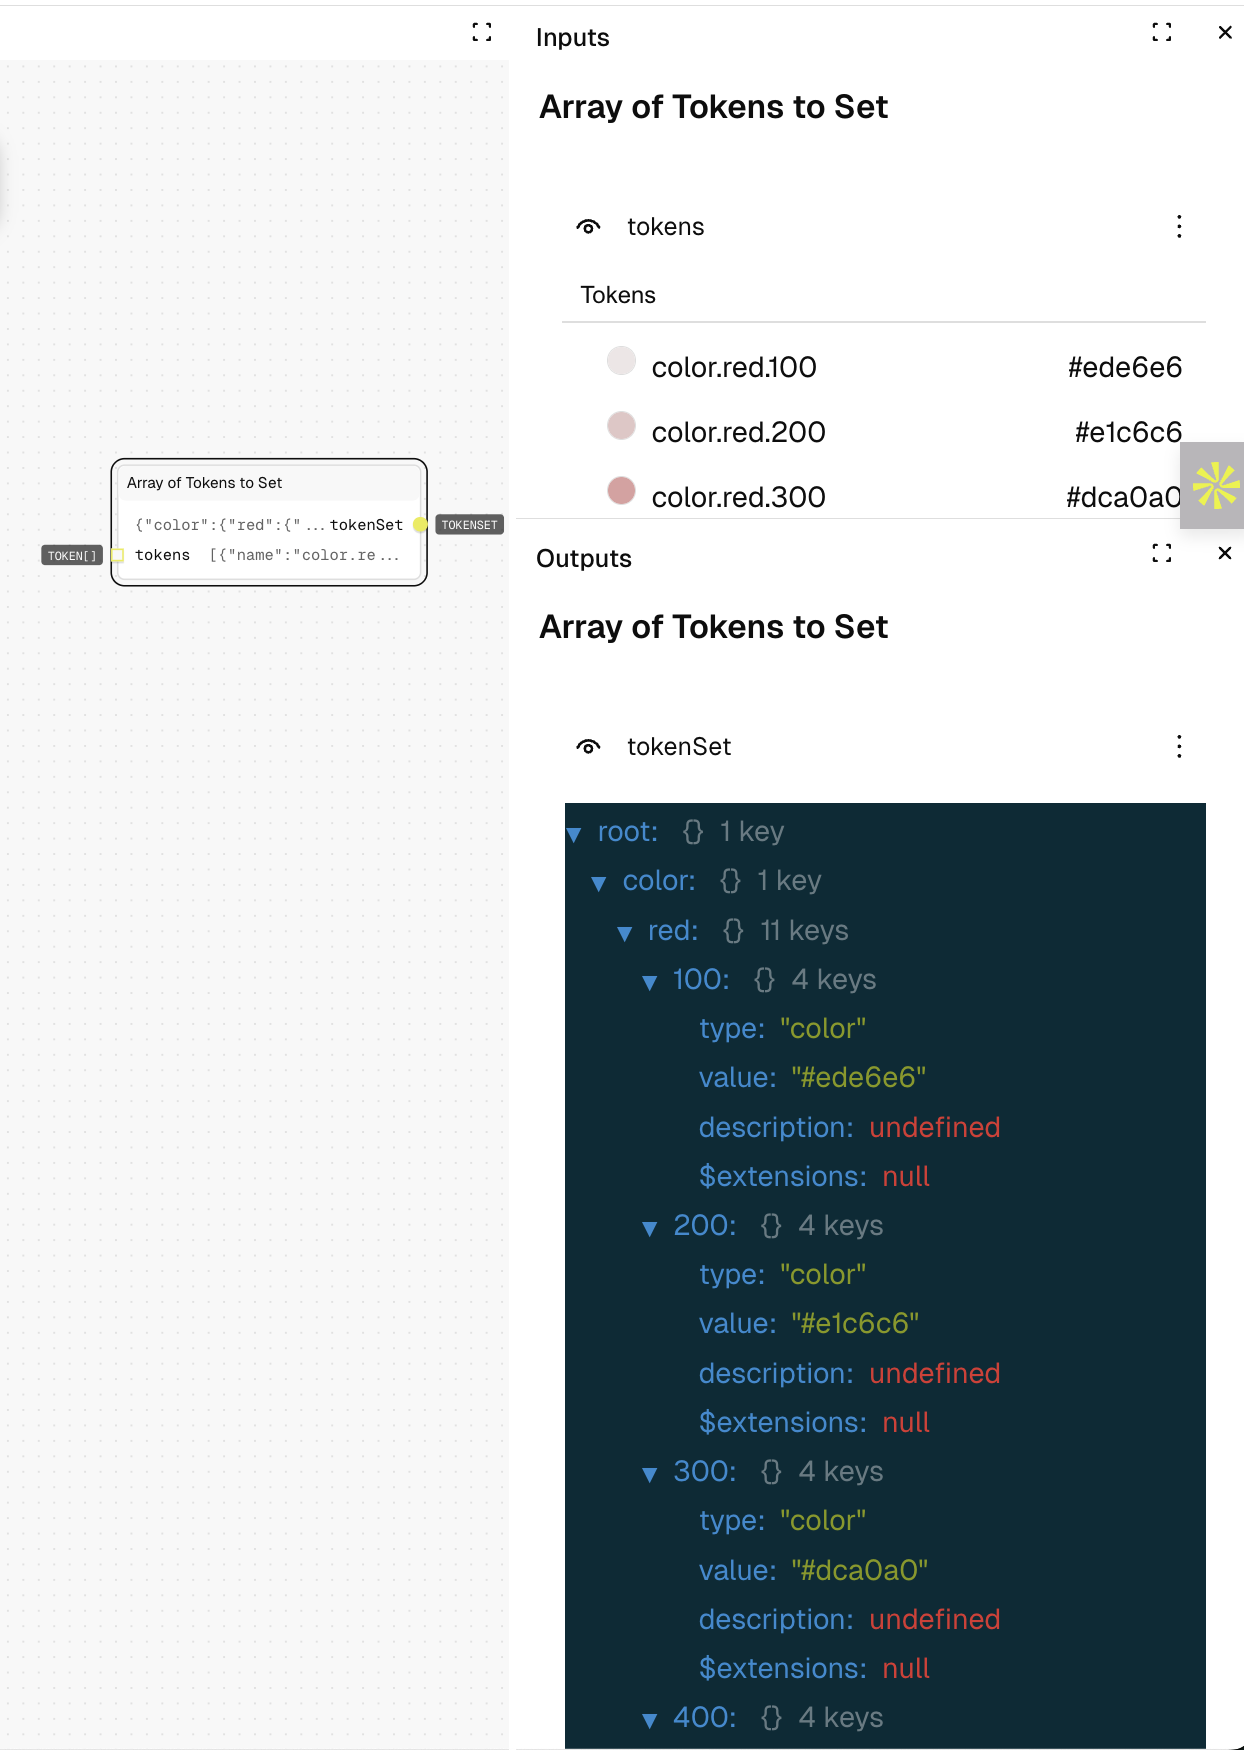
- To convert to a token set drag the Array of tokens to Set node. This will convert our design tokens from an array to a token set.
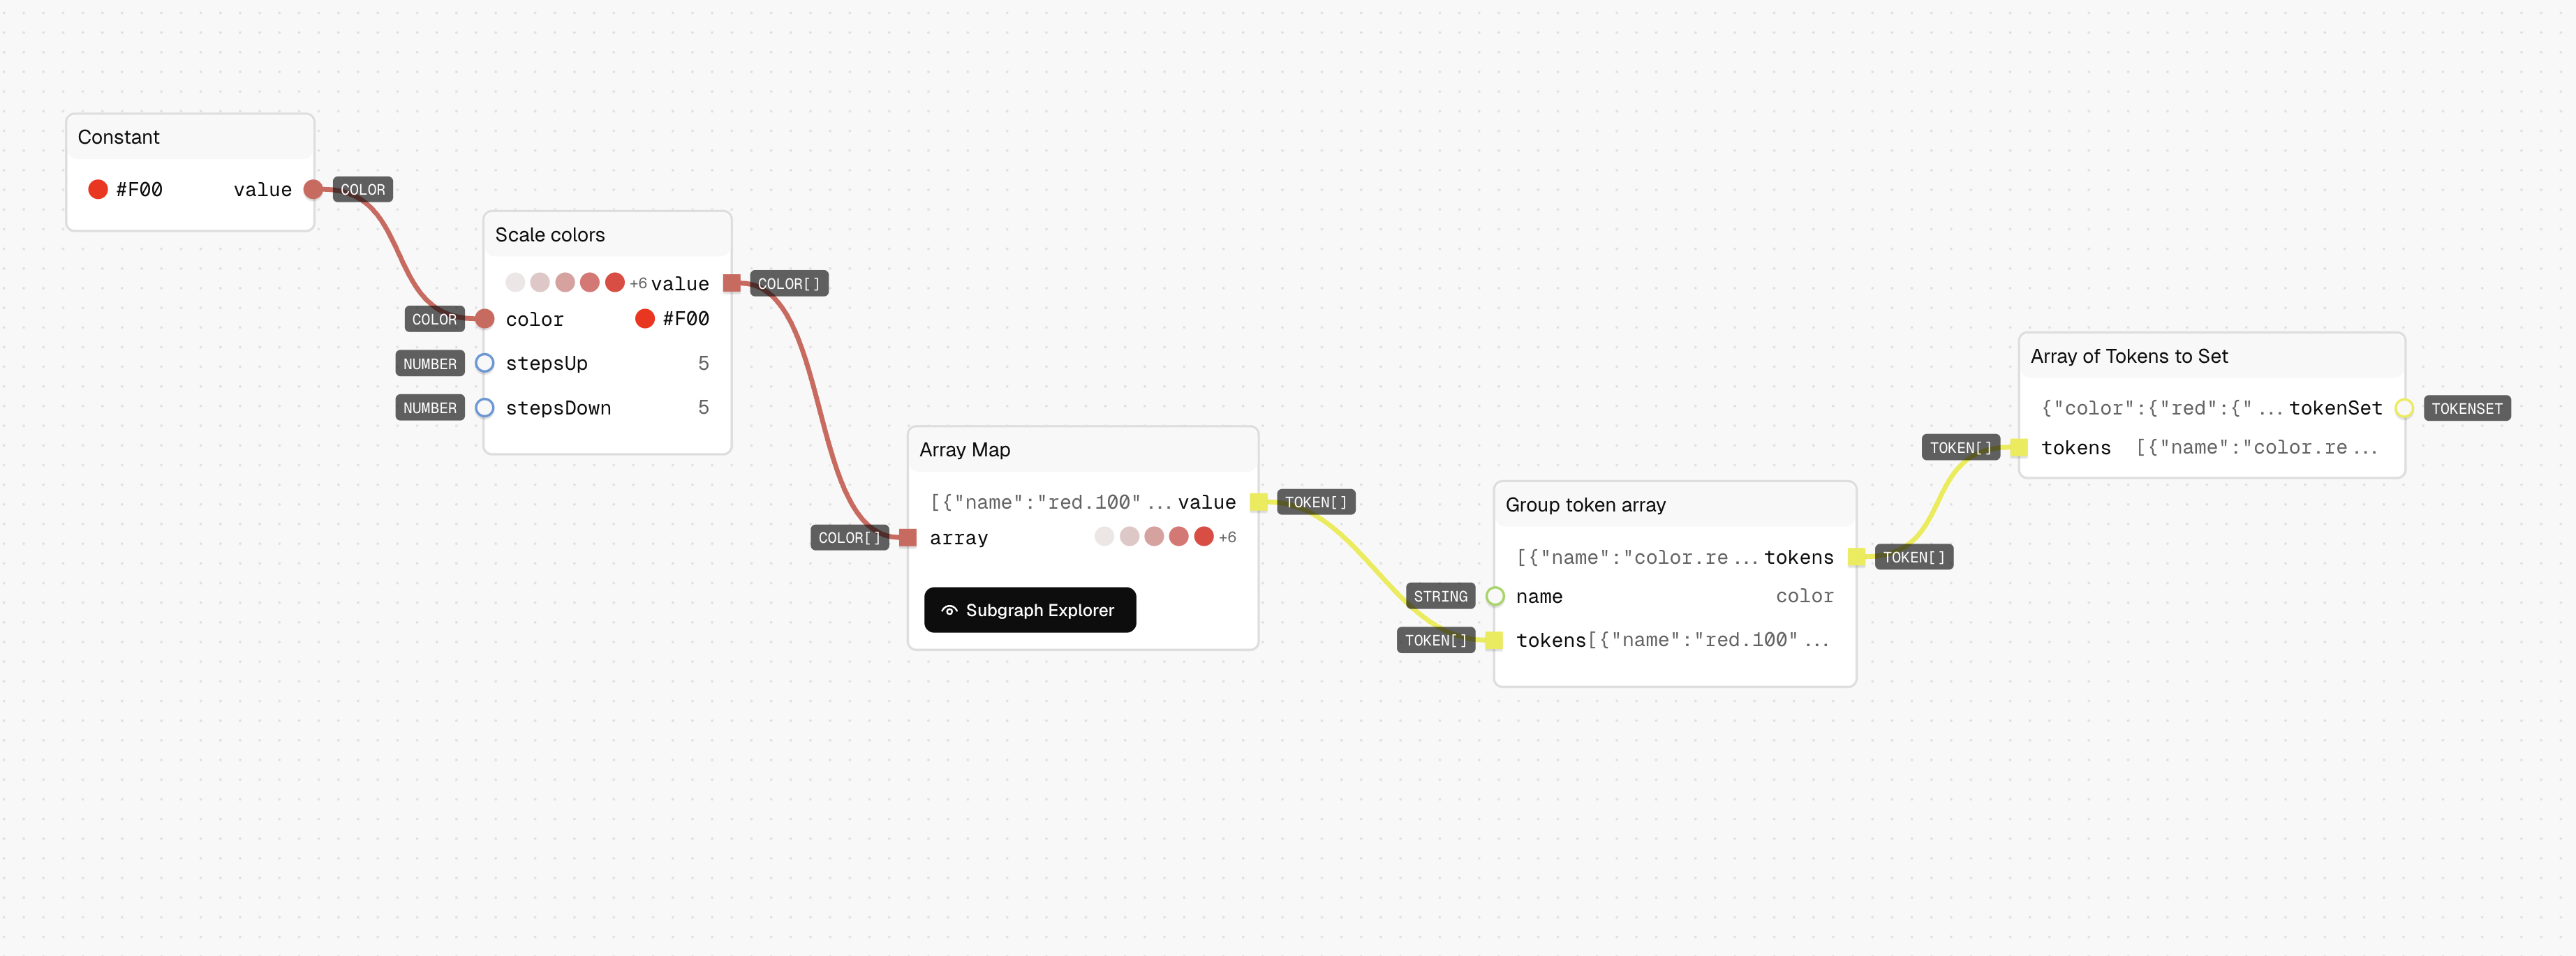
- The output of this node gives us the design tokens in the format
{
"color": {
    "red": {
        "100": {
            "value": "#ede6e6",
            "type" : "color",
        }
        ......
    }
}
}
Step 6: Final Output
- To get the design tokens into the table format we need to connect it to the Output node.
- Important: In the output node set the input in the right panel as "tokenSet".
- Connect the output from the previous node to the input of the Output node.
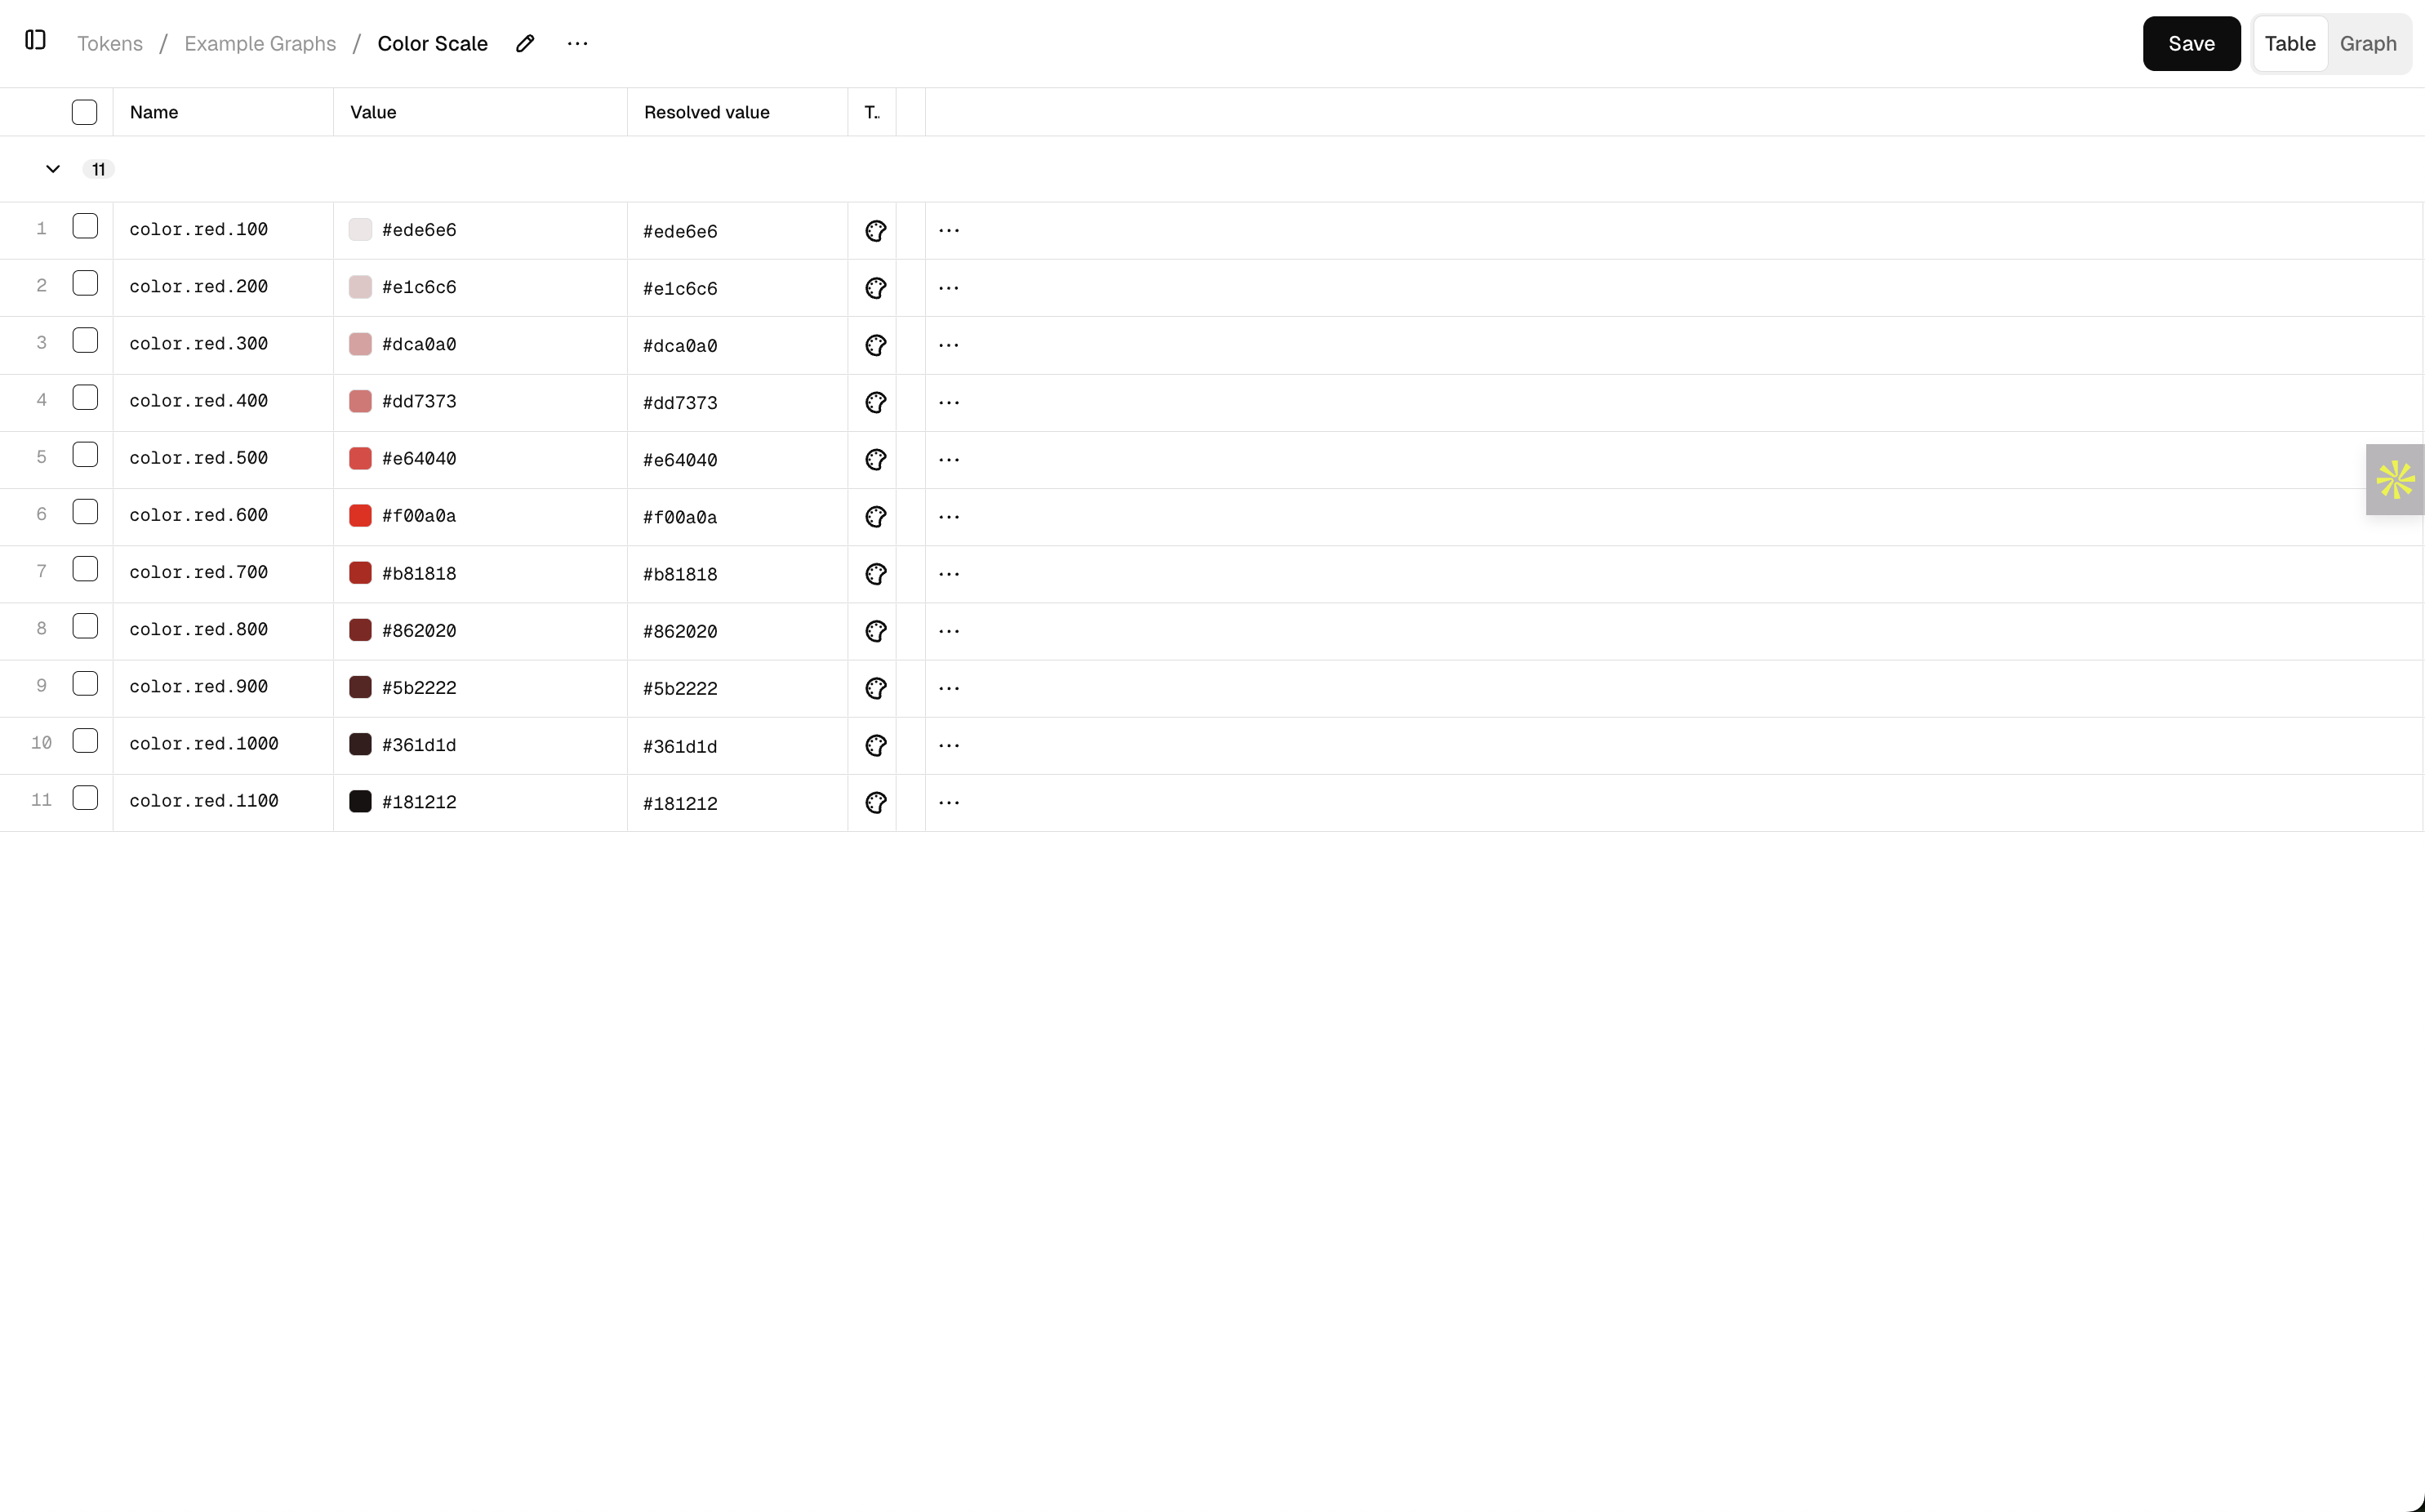
Step 7: Final Result
- The graph is now complete and it will output the design tokens. Remember to click on the "Save" button to make sure that you do not lose your graph.
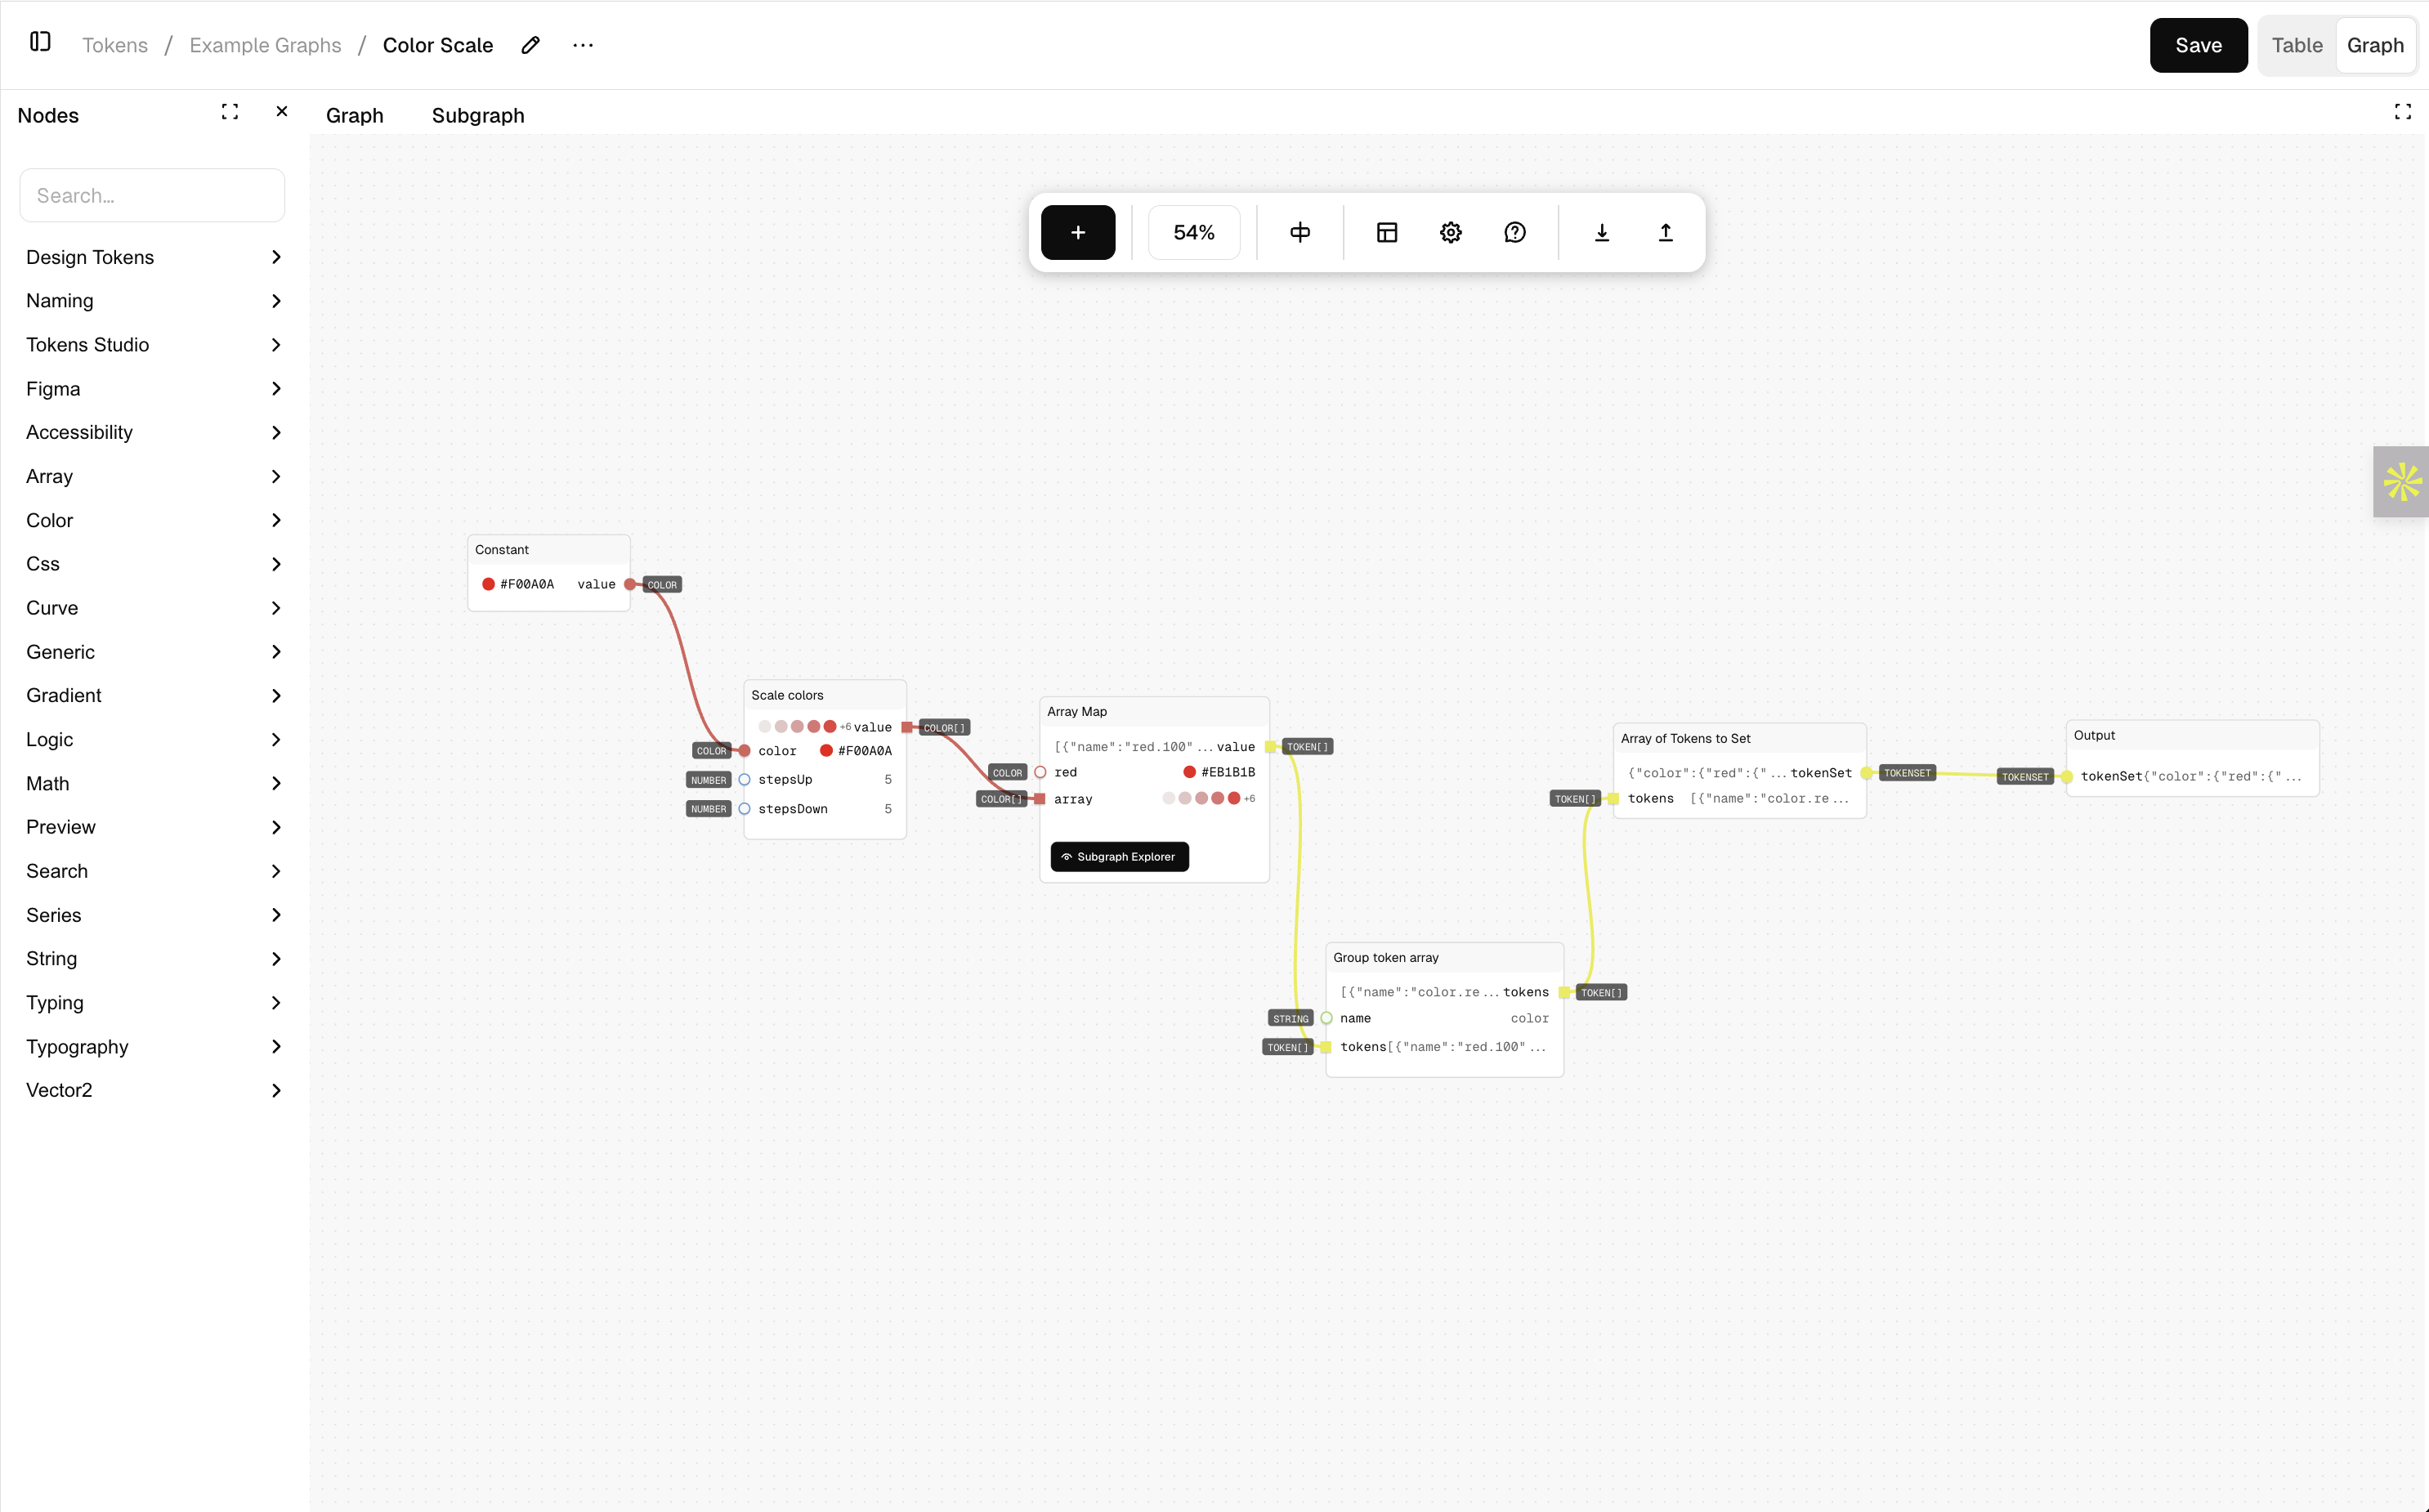
- To view the design tokens in table format, click on the "Table" button next to the "Save" button.
- We have a token set with colors generated from a single color which can be used as a reference in other sets. We can also now connect to the Tokens Studio for Figma plugin or the Companion by Tokens Studio plugin and use these design tokens in Figma.