Power Series
What It Does
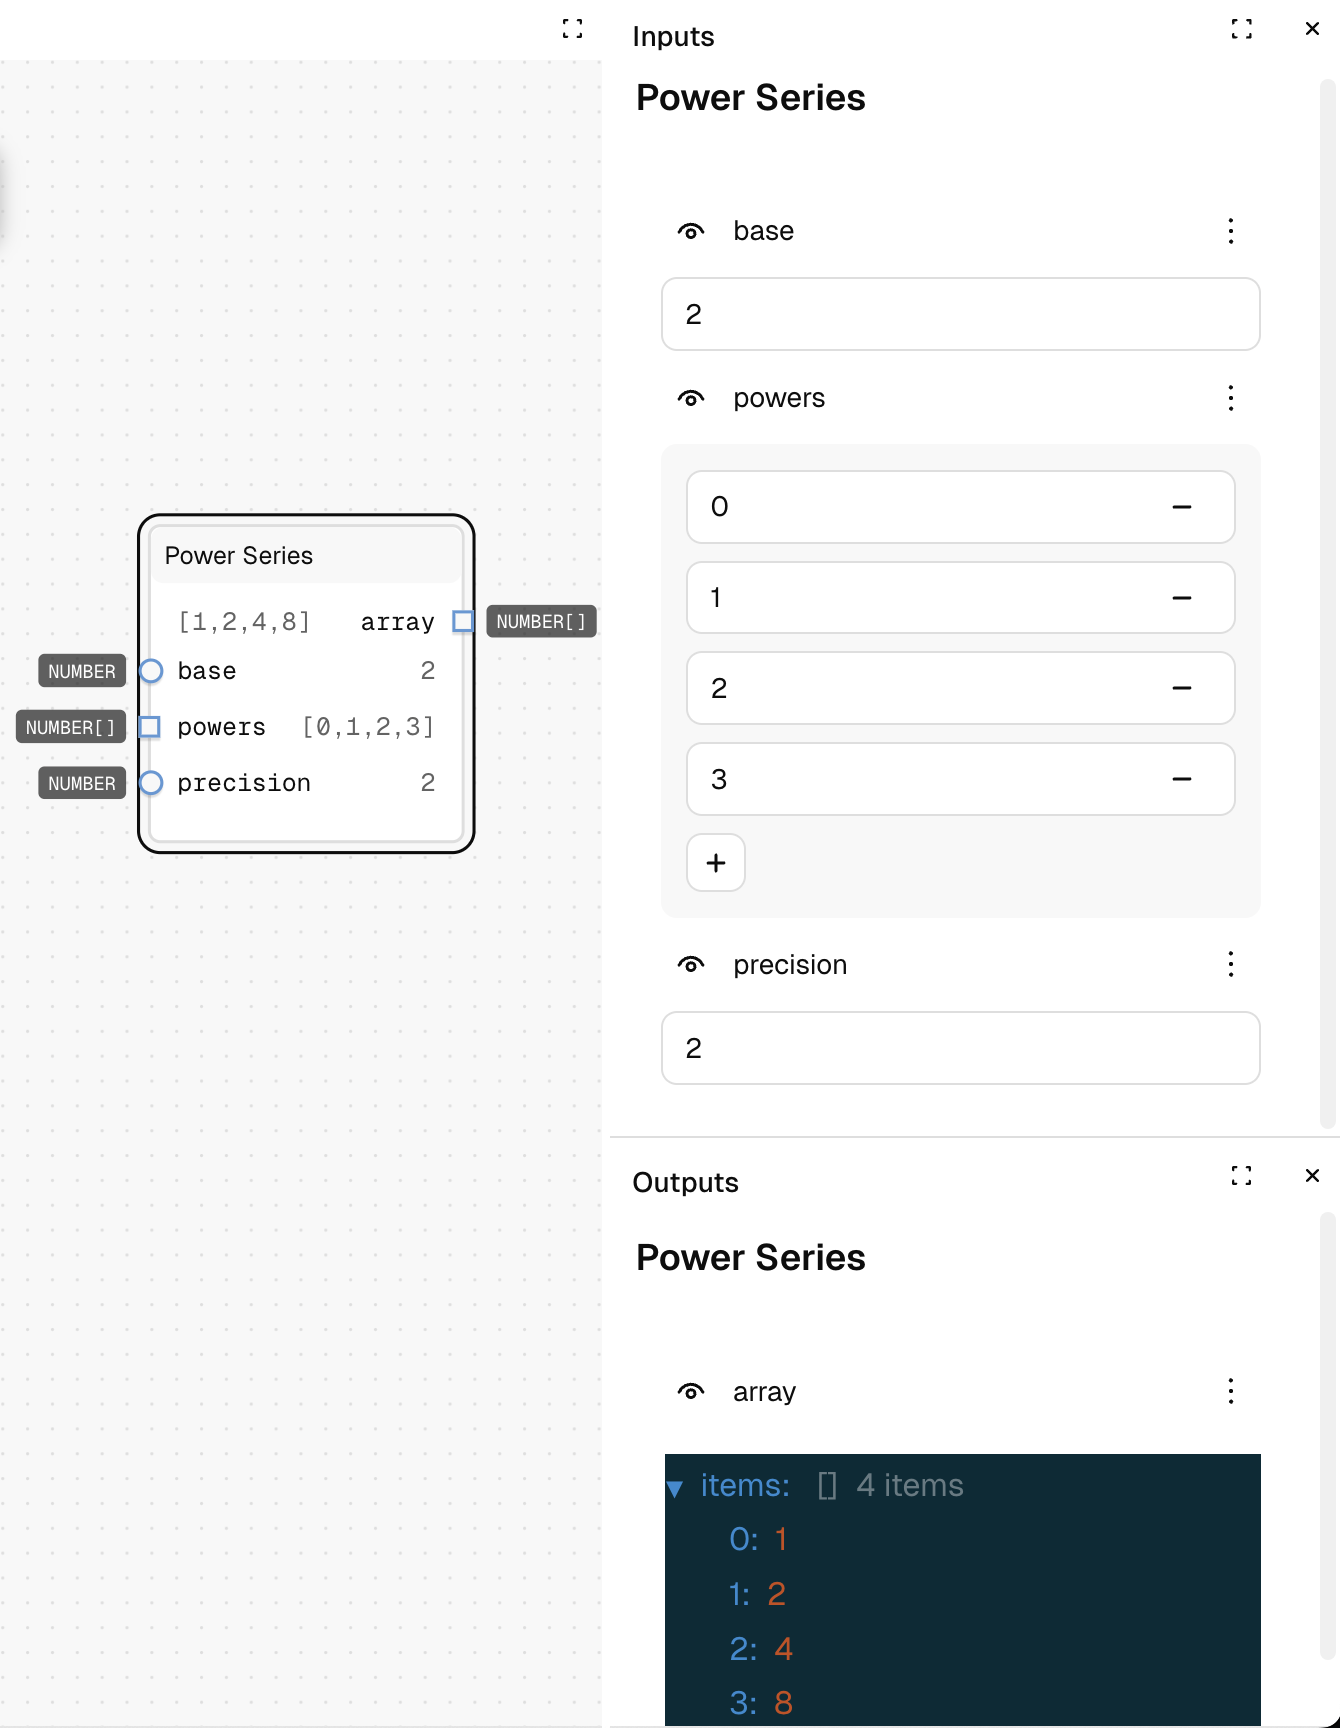
Generates a sequence of numbers by raising a base value to different powers. It creates values like base^power1, base^power2, etc., allowing you to create exponential progressions like powers of 2 (2⁰, 2¹, 2², 2³...).
Inputs
| Name | Description | Type | Required |
|---|---|---|---|
| base | The number to be raised to powers | Number | No |
| powers | List of exponents to apply to the base | List | No |
| precision | Number of decimal places to round to | Number | No |
Outputs
| Name | Description | Type |
|---|---|---|
| array | The sequence of power values | List |
How to Use It
- Drag the Power Series node into your graph.
- Set the "base" value (default is 2).
- Set the "powers" array to define the exponents (default is [0, 1, 2, 3]).
- Set the "precision" for decimal rounding (default is 2).
- Run the graph—with the default settings, your output will be [1, 2, 4, 8].
Tips
- The powers don't need to be integers—you can use fractions for roots (e.g., 0.5 for square root).
- Powers can be negative to get reciprocals (e.g., 2^-1 = 0.5).
- For binary progressions, use base=2; for decimal, use base=10.
See Also
- Geometric Series: For sequences with constant multiplication between terms.
- Math Pow: For calculating a single power expression.
- Exponential Decay: For sequences with exponential decrease.
Use Cases
- Binary Scales: Create powers of 2 (1, 2, 4, 8, 16, 32...) for memory or binary-related values.
- Logarithmic Scales: Generate exponential progressions for non-linear scales.
- Growth Modeling: Model exponential growth patterns.
- Data Storage: Generate size values for storage units (KB, MB, GB, TB).