Nodes
Introduction
Every node in the Graph Engine follows a consistent design, making them predictable and easy to use. They’re the building blocks of your graph, each handling a specific task—like adding numbers or merging objects—and passing data along to the next step.
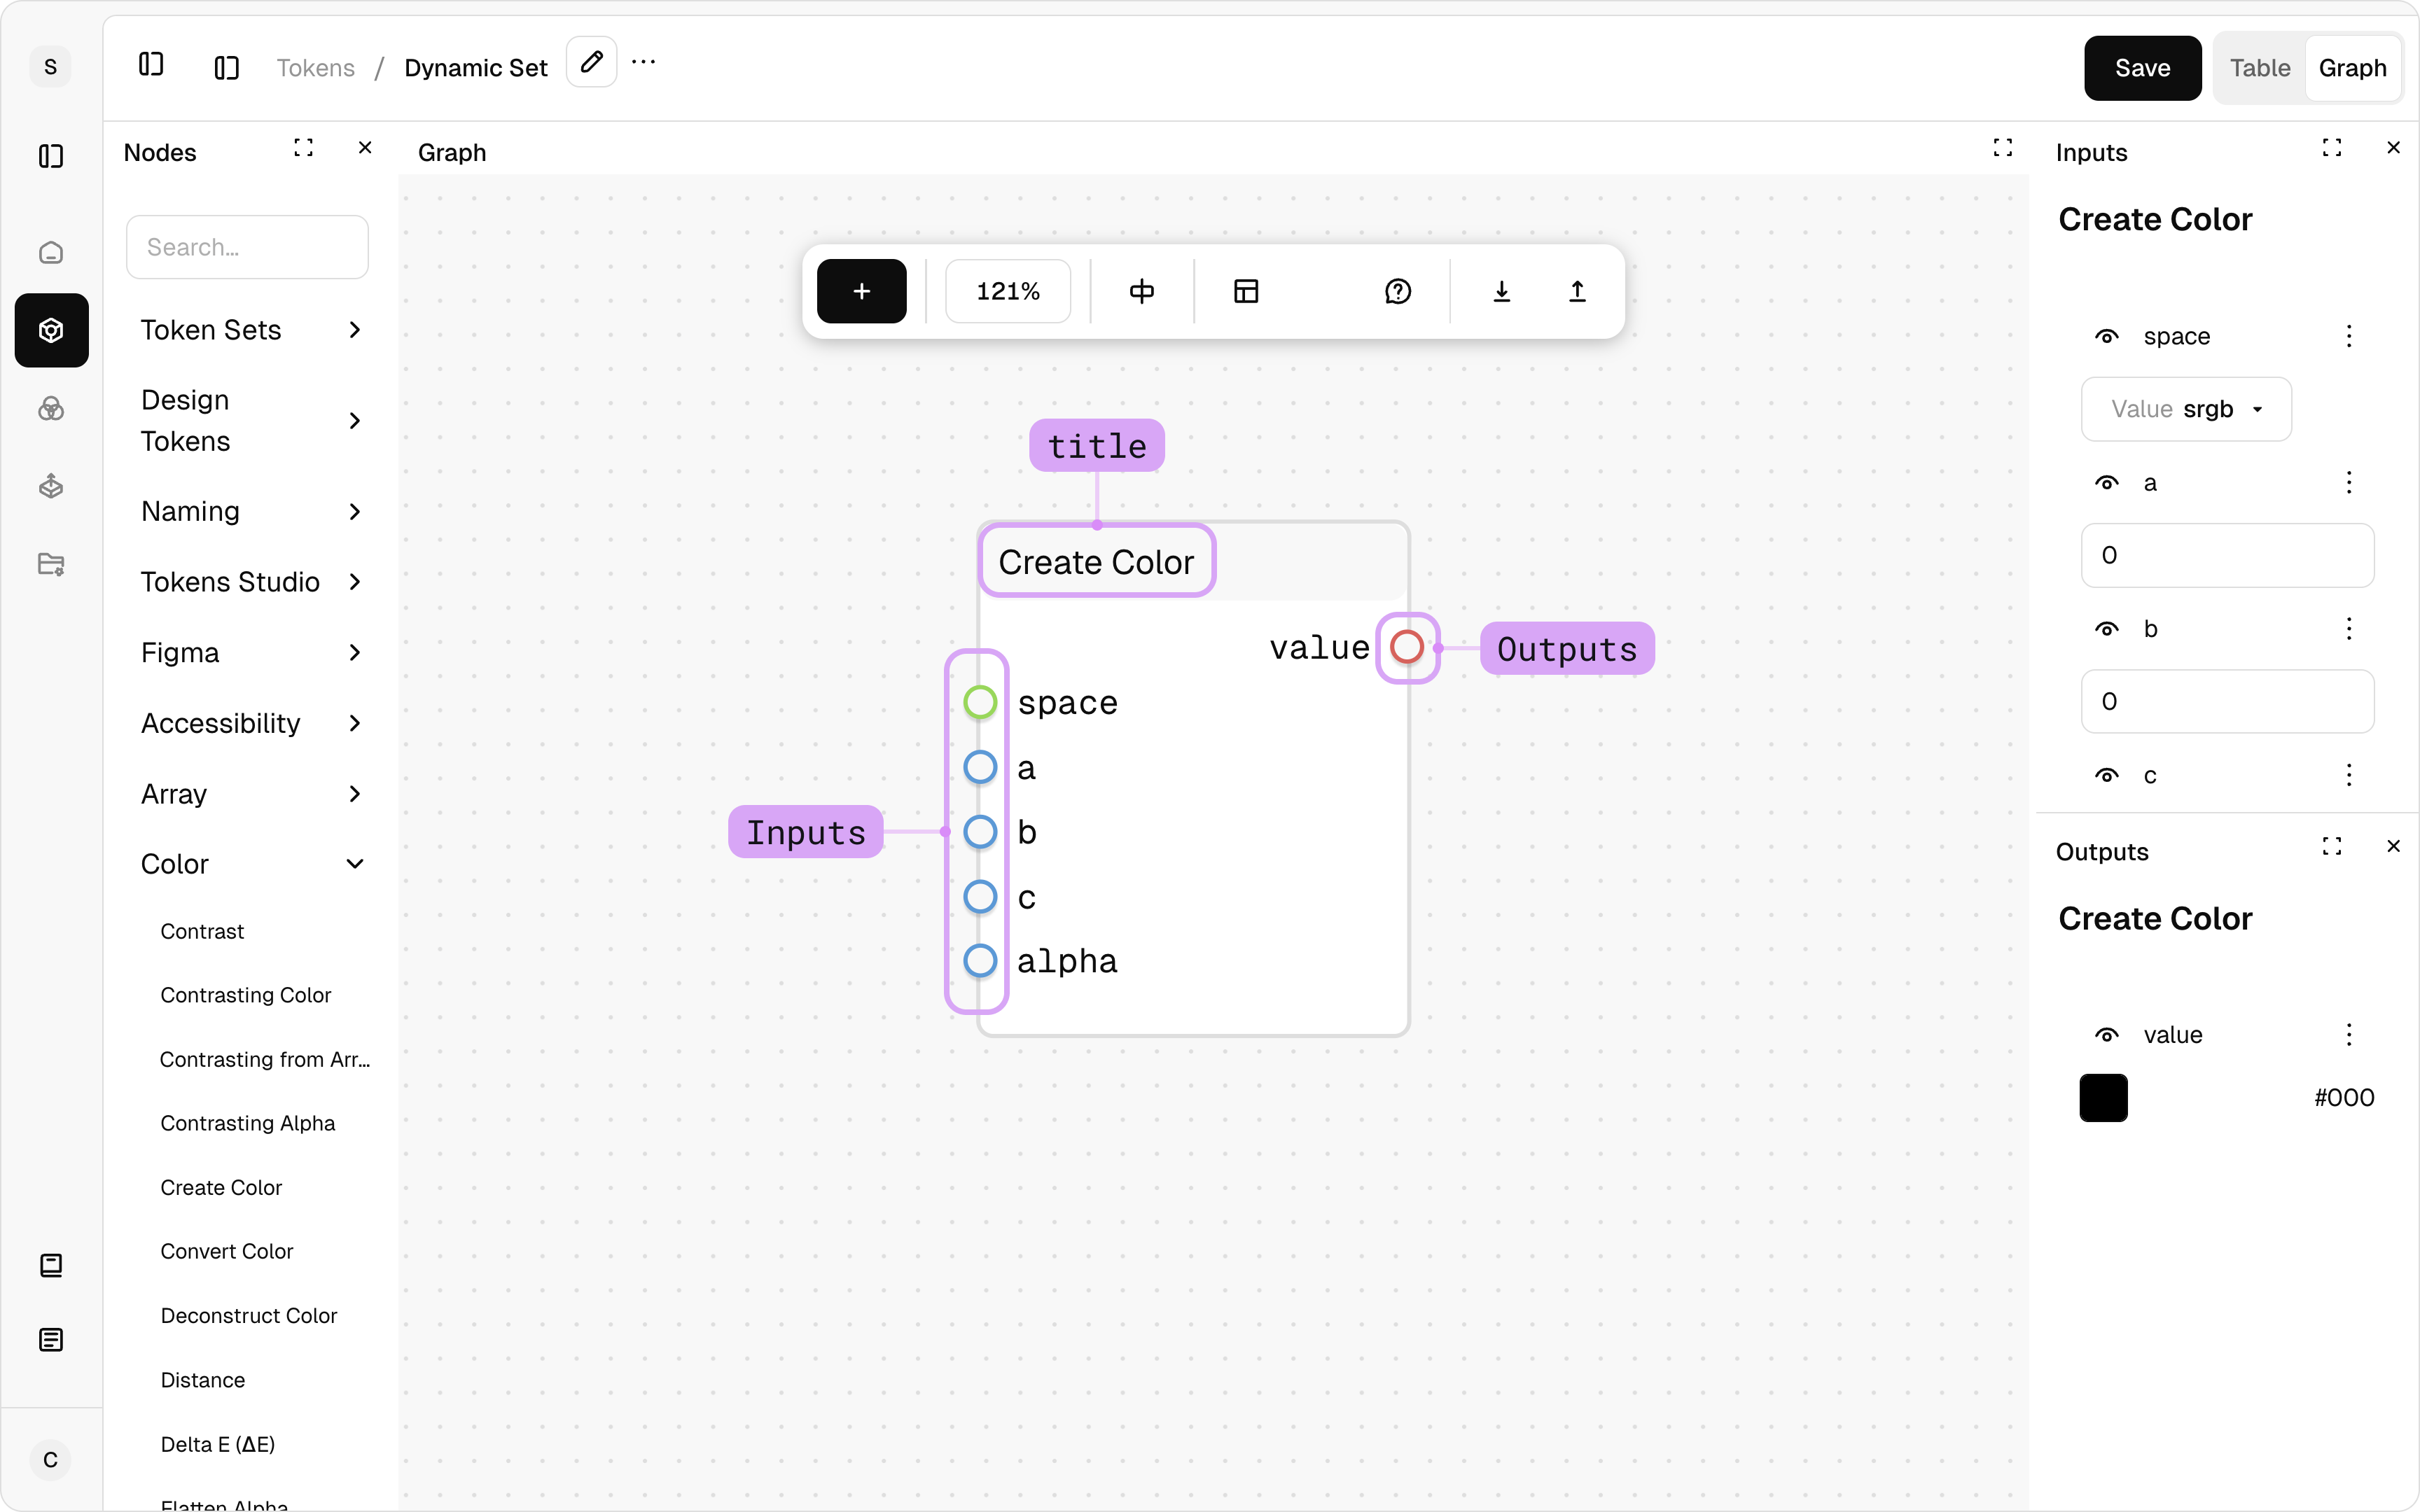
Parts of a Node
- Title: Tells you what the node does (e.g., "Add" or "Color Scale Generator"), shown at the top.
- Inputs: Ports on the left where data comes in. You can:
- Enter values manually in the Input Panel (e.g., type "10" or "#FF5733").
- Connect an output from another node to feed data dynamically.
- Outputs: Ports on the right where results come out. These can:
- Connect to other nodes’ inputs.
- Show results in the Output Panel for inspection (e.g., see "30" after adding 10 + 20).
- Inline Values (Optional): If turned on, displays the current value at each port (e.g., "#FF5733" next to a color output). This can be turned on from the Top Action Bar > Graph settings > Show Inline values.
- Port Types (Optional): If enabled, shows the data type (e.g., "number", "color") next to each port for clarity. This can be turned on from the Top Action Bar > Graph settings > Show Inline types.
Types of Nodes
Overview
Nodes range from simple helpers (e.g., adding two numbers) to powerful tools (e.g., generating token sets). They’re grouped into categories to keep things organized, covering math, data manipulation, design-specific tasks, and more.
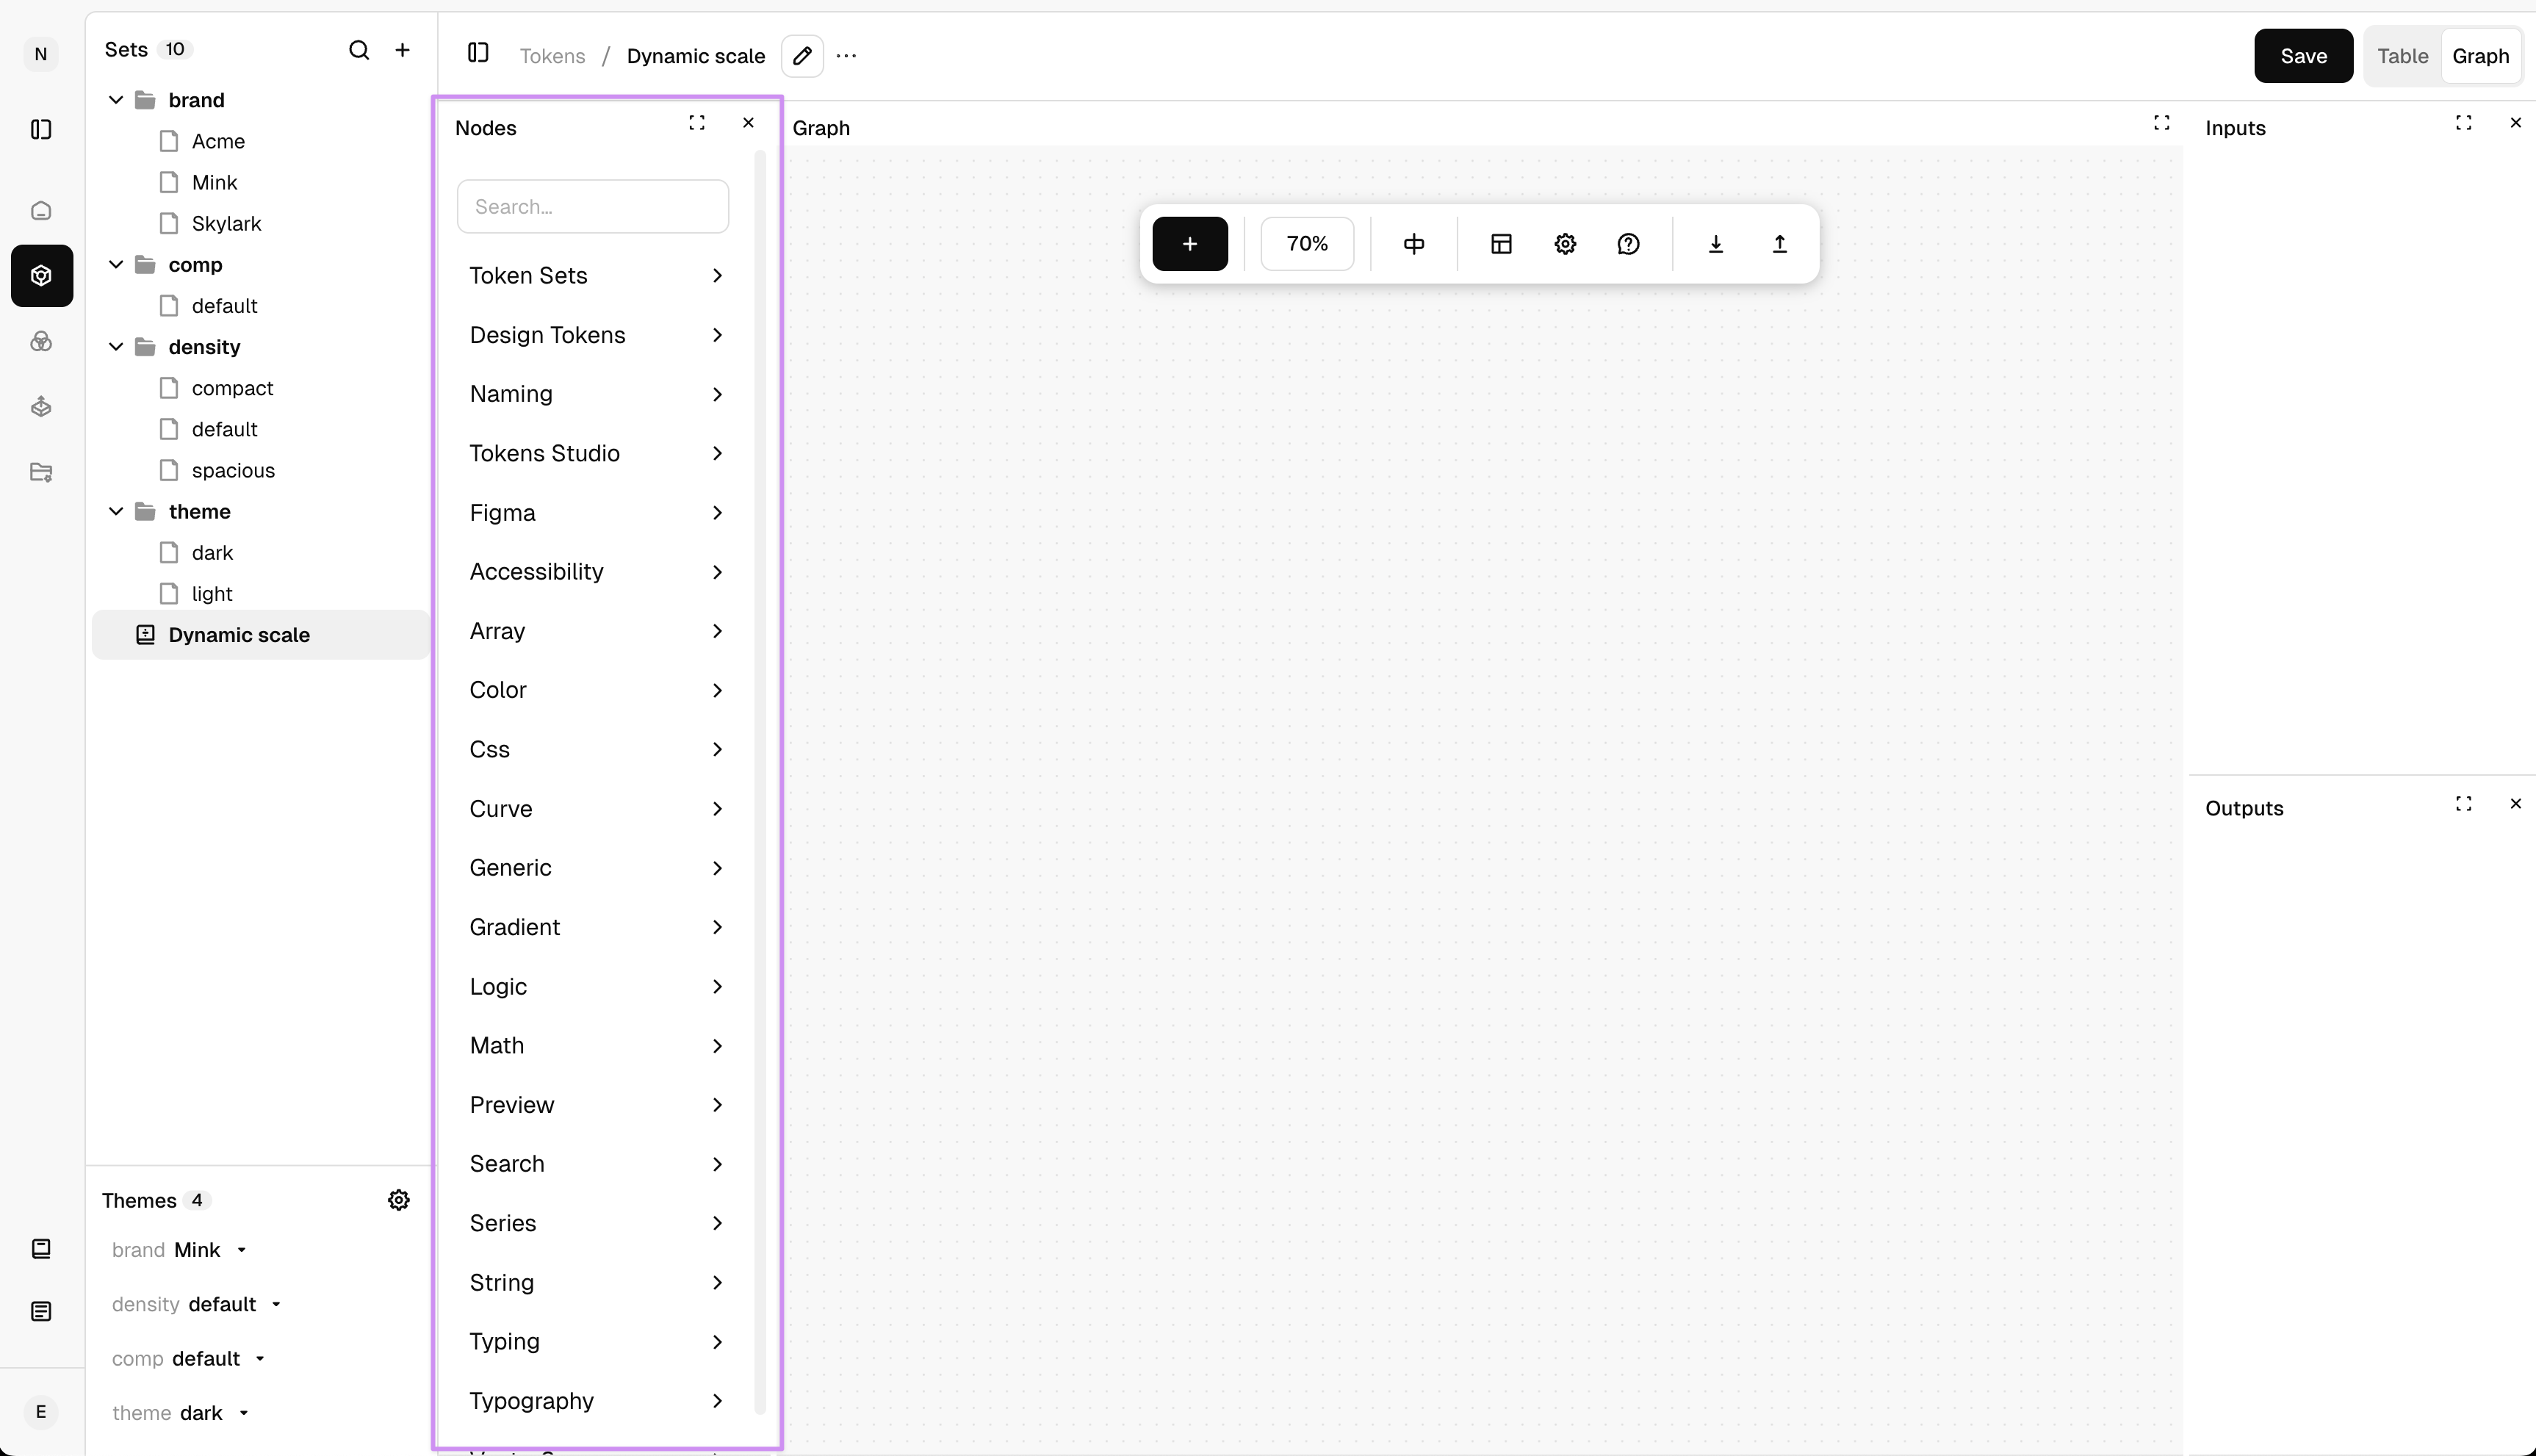
Node Categories
- Token Sets: Gives access to existing static token sets in the project.
- Design Token Nodes: Build or tweak tokens (e.g., "Create Design Token" creates a Design Token from inputs).
- Naming Nodes: Generates dynamic names (e.g., "Numeric Scale" generates numeric scale with optional prefix, suffix, and multiplier).
- Tokens Studio: Specific to Tokens Studio (e.g., "Themes" retrieves a list of all themes and their options).
- Figma Nodes: Specific to Figma to allow better integration (e.g., "Scope Color" defines color variable scopes for Figma).
- Accessibility Nodes: Specialized nodes designed to enhance inclusivity and compliance with accessibility standards in digital products (e.g., "Color Blindness" converts provided colors to the colors as perceived by the specified color blindness type).
- Array Nodes: Process lists (e.g., "Array Map" applies a graph to each item in an array).
- Color Nodes: Manage and manipulate colors, enabling generation, blending, conversion, and validation of color values (e.g., "Scale colors" creates a scale/ramp of colors based on a given color by specifying the number of steps up and down).
- CSS Nodes: Generate, modify, and output CSS properties (e.g., "CSS Map" exposes all the css properties. You can link the input of any other node to the any property that is there in the css map node).
- Curve Nodes: (e.g., Bezier Curve creates a bezier curve from two control points)
- Generic Nodes: These nodes help with input/output management, debugging, data structuring, and control flow (e.g., Input allows you to provide initial values for the whole graph).
- Gradient Nodes: Handles the creation, manipulation, and interpolation of gradient colors (e.g., Gradient Stop creates a gradient stop).
- Logic Nodes: Make decisions (e.g., "If" checks conditions like "is this number > 5?").
- Math Nodes: Handle calculations (e.g., "Add" sums numbers, "Multiply" scales values).
- Preview Nodes: Provide a visual representation of the node’s output (e.g., "Color Scale" previews a color scale).
- Search Nodes: Findins specific values within lists or datasets (e.g., "Linear Search" performs a linear search on an array to find the index of a target value).
- Series Nodes: Generates and manipulates mathematical sequences (e.g., "Geometric Series" generates a geometric series f(n)= c * (f(n-1)) of numbers based on the base value, steps down, steps and increment).
- String Nodes: Handles text-based operations, enabling manipulation, formatting, and analysis of string data (e.g., "Lowercase" converts a string to lowercase).
- Typing Nodes: Ensures data integrity by validating, converting, and managing data types (e.g., "Pass unit" adds a unit to a value if it doesn't already have one).
- Typography Nodes: Handles text styling, font properties, and typographic calculations (e.g., "Base Font Size" calculate the base font size with DIN 1450. The output is a number representing the font size in pixels.)
- Vector2 Nodes: Deals with 2D vector operations, enabling calculations, transformations, and manipulations of two-dimensional coordinate-based data (e.g., "Create vector2" allows you to create a vector2).
Subgraph & Array Map Nodes
These are nodes with big-picture concepts:
- Subgraph Node:
- What It Does: Groups multiple nodes into one reusable node, showing only the key inputs and outputs.
- How: Select nodes, right-click, and choose "Create Subgraph". Click on Subgraph Explorer to edit inside.
- Array Map Node:
- What It Does: Runs a graph on each item in an array and collects the results.
- Example: Input an array of colors (["#FF5733", "#33FF57"]), use an internal graph to convert each to HSL, and output ["hsl(14, 100%, 60%)", "hsl(150, 100%, 60%)"].
- How: Drag in an Array Map node, define its internal graph, and connect an array to its input.